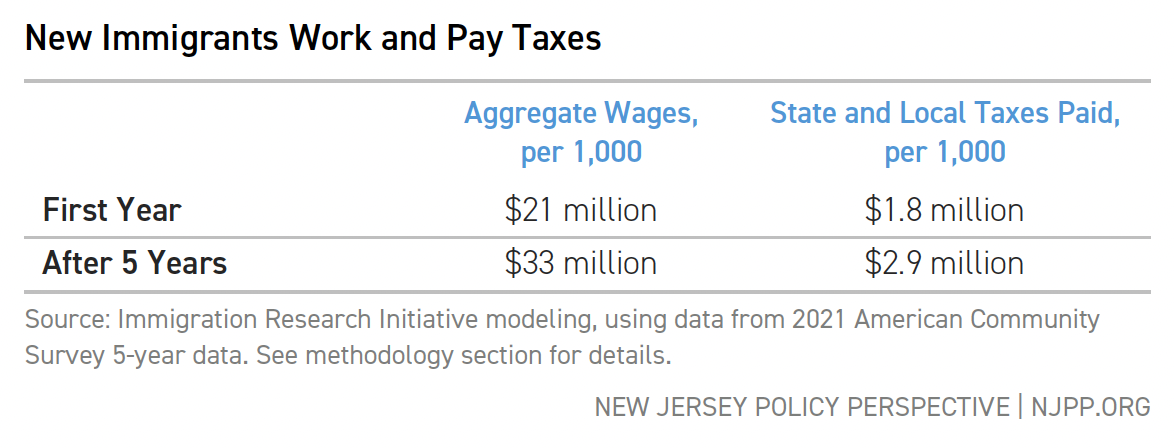
Immigrants are a Vital Part of New Jersey’s Future

Published on Nov 26, 2024 in Economic Justice, Immigrants' Rights

Immigrant workers and business owners grow New Jersey’s economy

2.2 million immigrants reside in New Jersey. Immigrants work in low-wage, middle-wage, and higher-wage jobs in sectors across our state’s economy.

29% of New Jersey’s workers are immigrants, including:

Icons-02

22% of retail salespeople

Icons-03

30% of registered nurses

Icons-04

64% of software developers

45% of Main Street business owners in New Jersey are immigrants, operating storefront shops that help keep downtown areas vibrant.


Immigrant workers and business owners generate $194 billion of economic output in New Jersey. Immigrant contribution to GDP is about the same as immigrant share of the labor force.

Immigration increases opportunity for people in New Jersey

When immigrants move to New Jersey, the economy grows. That doesn’t mean fewer jobs, it means more jobs: there are more consumers, more workers, and more business owners. Study after study shows there is no fixed number of jobs in a state. Immigration creates opportunities that benefit U.S.-born workers too.

As New Jerseyans age, we’ll need more workers

As our population ages, new immigrants help keep our economy growing at a sustainable rate. Immigrants help meet growing needs for health care, home care, and supportive services that are key for older New Jerseyans to have a dignified retirement.

Icons

Some people try to scapegoat immigrants to keep us divided. We don’t have to fall for it.

After decades of stagnating wages, today wage growth is starting to move in the right direction. We know how to create a good economy for workers. It requires uniting around policy choices like investments in infrastructure, manufacturing, and our care economy with strong labor standards. Regardless of race or country of birth, we all do better when we unite for policies that grow jobs and wages.

IRI-logo-FULL-COLOR
economic-policy-institute-epi-logo
njpp-logo-initials

For sources and methodology, visit immresearch.org/publications/states 

When you give to NJPP, you power the research, communications, and partnership building necessary to make policy work for people, so every New Jerseyan can achieve their goal for a healthy and vibrant life.

Understaffed and Underfunded: Barriers to Effective Anti-Poverty Assistance

This report was produced in partnership with Communication Workers of America.


Introduction

Workers at county social service agencies across New Jersey provide essential support to our families, friends, and neighbors. They help elders struggling with dementia navigate the process of applying for Medicaid, support veterans in need, and work tirelessly to ensure that hungry children are fed, clothed, and cared for. From Newark to Warren County, social service workers uphold the value of service and care that is the backbone of our shared humanity. Our communities thrive when social service agencies are adequately supported, yet chronic understaffing and underfunding hinder the stability these agencies provide. Low pay and high turnover harm not only the dedicated employees who serve our counties and state but also ripple outward, disrupting vital safety net programs and benefits on which countless individuals and families rely. State leaders often tout these programs as advantages of living in New Jersey, but poor implementation means that residents aren’t getting the help they need.

A new survey conducted by the Communications Workers of America (CWA) of its members working in New Jersey county social service agencies finds that declining staffing and increasing caseloads impact their ability to assist New Jersey residents. Across the county agencies surveyed:

  • Staffing levels from 2019 to 2023 decreased 3.2 percent while caseloads increased 32.4 percent;
  • Nearly three-quarters of respondents in the survey reported that understaffing prevents families from receiving benefits in a timely manner;
  • A majority of respondents cited low pay as a primary driver of understaffing.


These results demonstrate the importance of ensuring employees can deliver quality service so residents can access these vital state programs. By increasing pay, setting and enforcing minimum staffing requirements, and providing benefits that improve work-life balance for agency workers, county leaders can better serve their communities.

Thousands in New Jersey Rely on County Agencies for Assistance

Federal and state benefit programs go through administrative processes to reach eligible participants. County social service agencies and the workers that run them are the community connection administering these programs. These workers evaluate applications and provide eligible residents with the services of New Jersey’s public assistance programs, including:

  • Work First New Jersey (WFNJ) (Temporary Assistance for Needy Families [TANF], General Assistance [GA], and Emergency Assistance [EA])
  • Supplemental Nutrition Assistance Program [SNAP]
  • NJ FamilyCare (New Jersey’s Medicaid and Children’s Health Insurance Program)
  • Child support services
  • Other assistance programs for the elderly, residents living with disabilities, and more.[i]


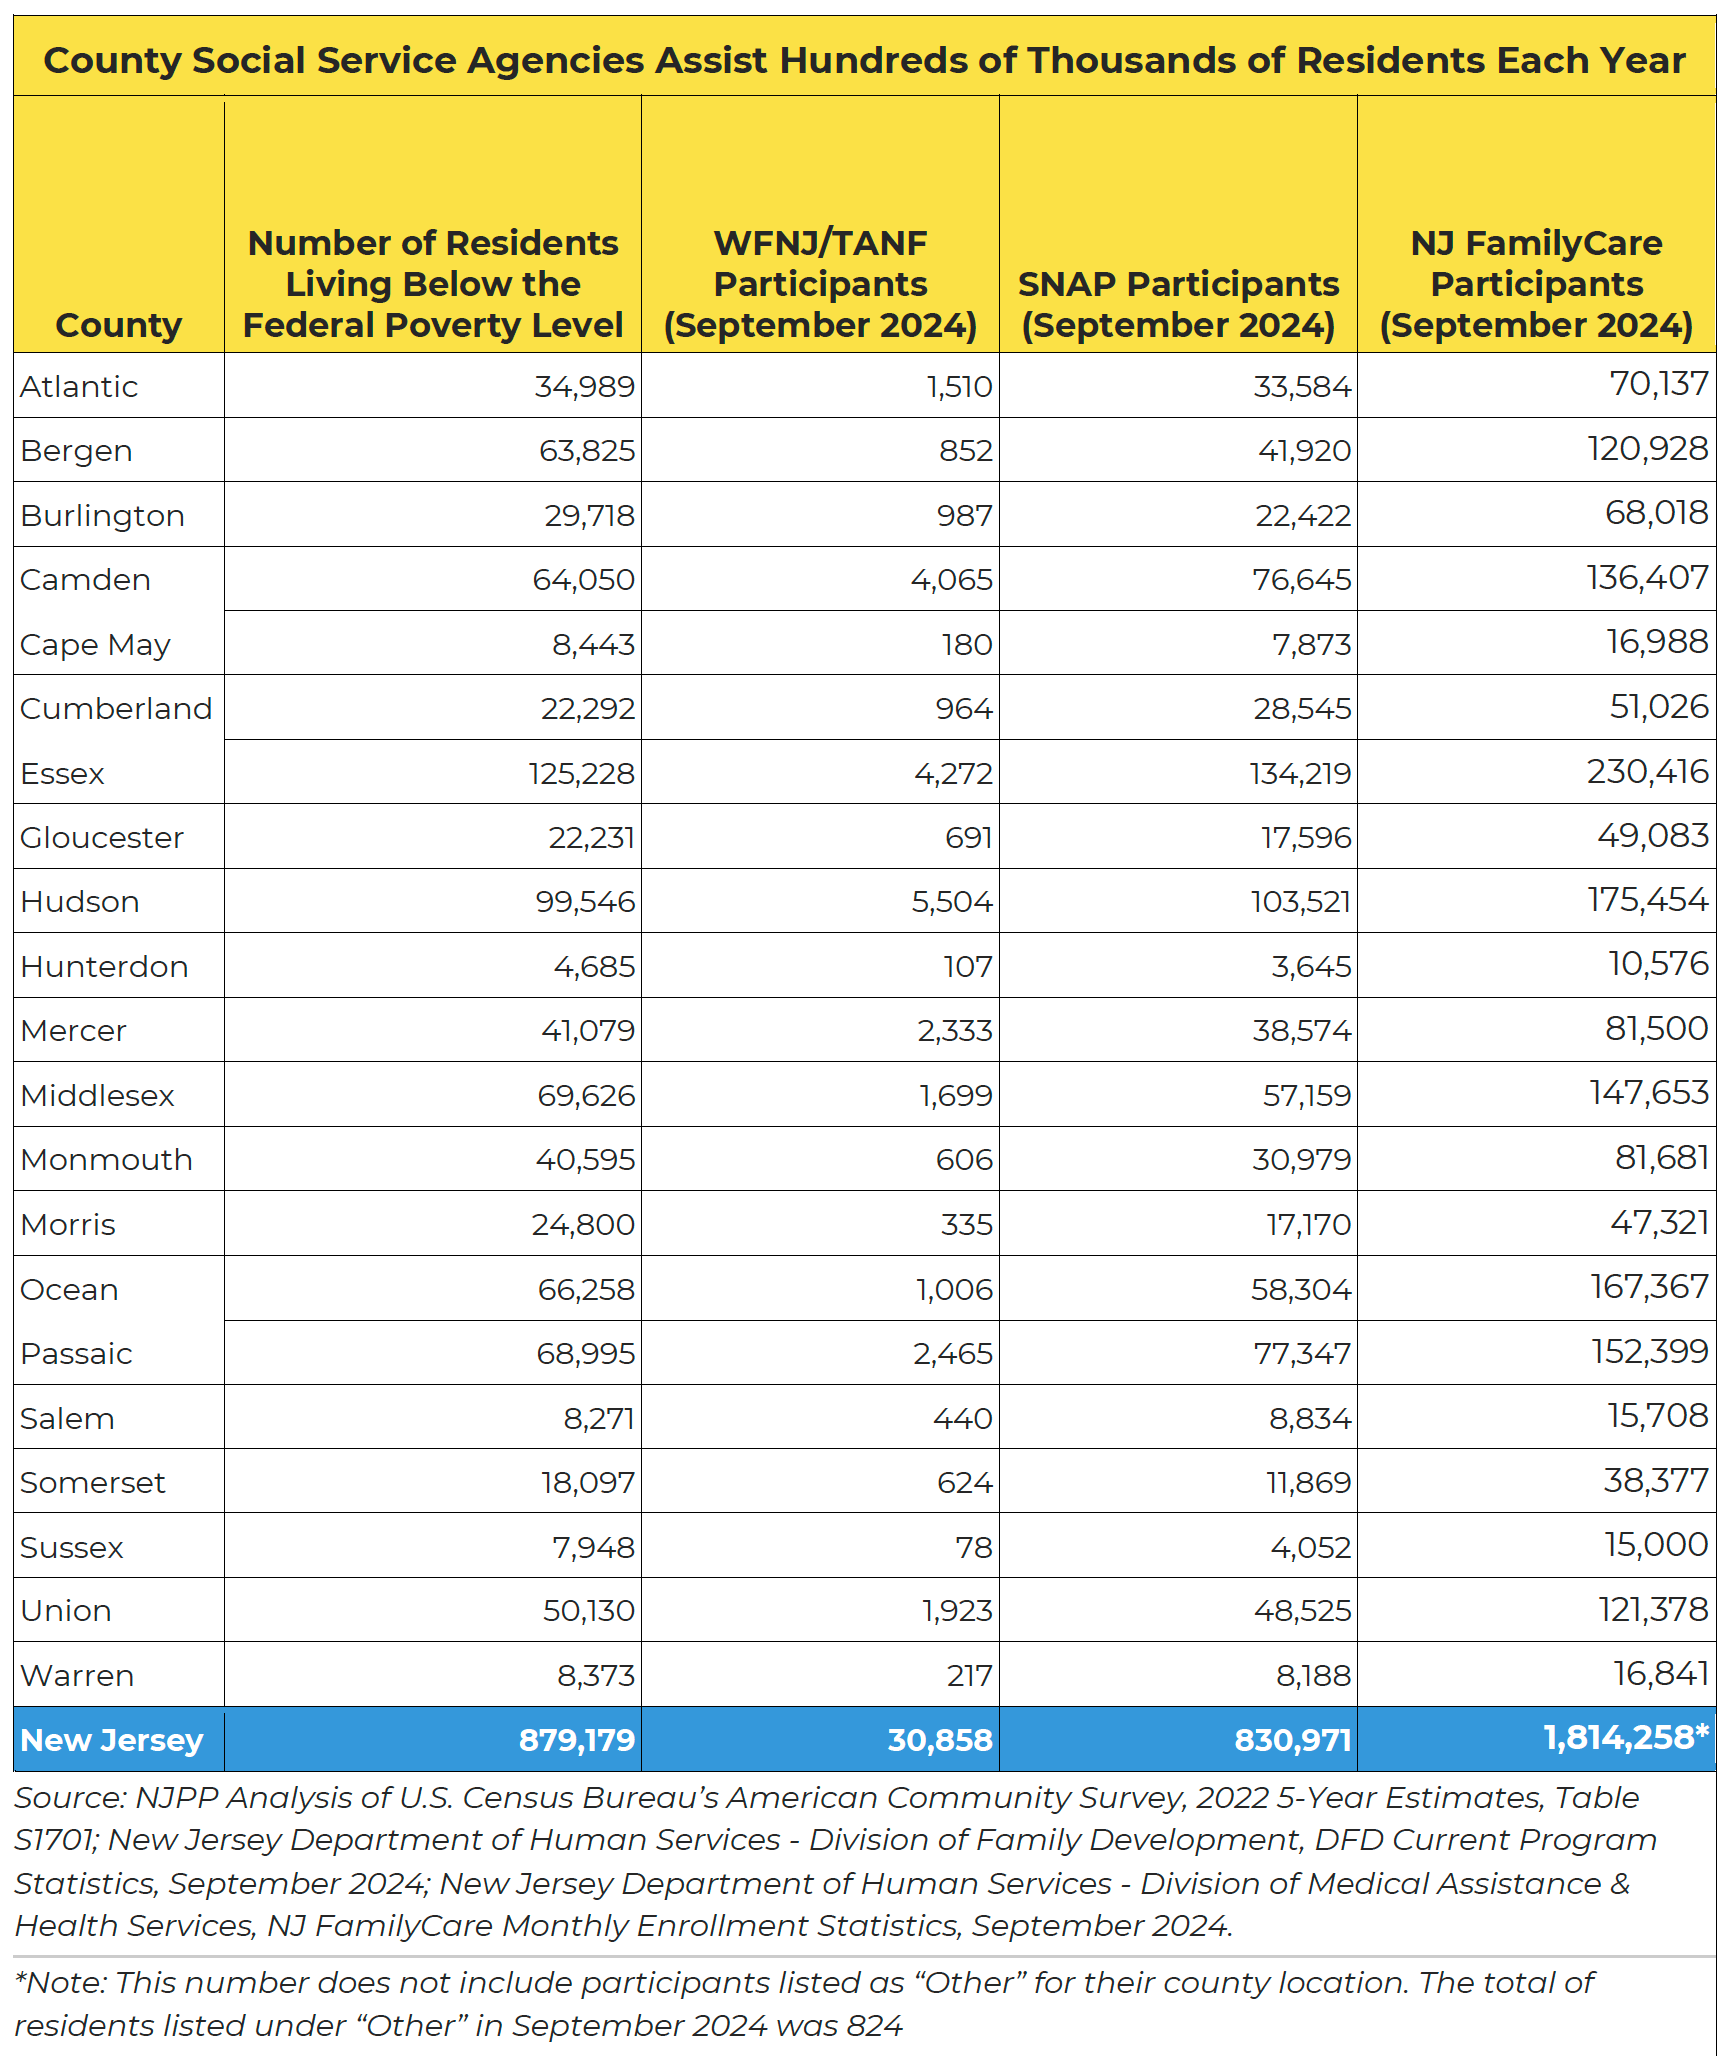
With nearly 31,000 people currently served by the WFNJ/TANF program, over 830,000 residents currently served by the SNAP program, and over 1.8 million participants in NJ FamilyCare, the county social service agencies are responsible for assisting hundreds of thousands of families each month.[ii]

County Social Service Agencies Assist Hundreds of Thousands of Residents Each Year

There must be enough staff at county social service agencies to serve all eligible residents, regardless of differences across program rules. For example, with its more generous eligibility standards, the SNAP program helps a large number of residents in comparison to the number of residents living in poverty in many counties. Serving eligible residents with timely responses and support to get them the nutrition they need requires a high level of staff capacity.

Insufficient staff capacity combined with problematic program requirements results in fewer residents in need seeking and receiving assistance. The TANF program faces this challenge regularly. With its stringent eligibility requirements that have not changed significantly since the 1990s, TANF becomes more outdated each year and helps fewer and fewer residents in poverty.[iii] These requirements, in combination with low benefits relative to the cost of living, can make eligible residents hesitant to apply. When there are not enough staff to process applications on a timely basis, answer questions, and support those seeking help, the already-existing problems with access to these programs become further exacerbated.

To counteract affordability challenges and more effectively help the nearly 880,000 residents living in poverty, New Jersey leaders must take a two-pronged approach: update program requirements and benefits policies and increase pay and benefits for social service workers, a key step in addressing staffing shortages. 

Undervaluing Workers Delays and Denies Benefit Access

Understanding the working conditions for county social service agencies can help leaders identify how to improve assistance in the state’s anti-poverty programs. A 2024 survey distributed to the 3,000 CWA members employed at county social service agencies across New Jersey examined the connection between staffing levels, workloads, and benefit distribution.[iv] This survey, in combination with data gathered from the Open Public Records Act, requests on staffing and pay levels, highlights the critical role of workers at county agencies in supporting the state’s lowest-income families.

Turnover and Slow Hiring Leaves County Agencies with Low Staffing Levels

When social service agencies are short-staffed, workers are often overwhelmed by the volume of applications and the processing time needed to help all eligible residents.

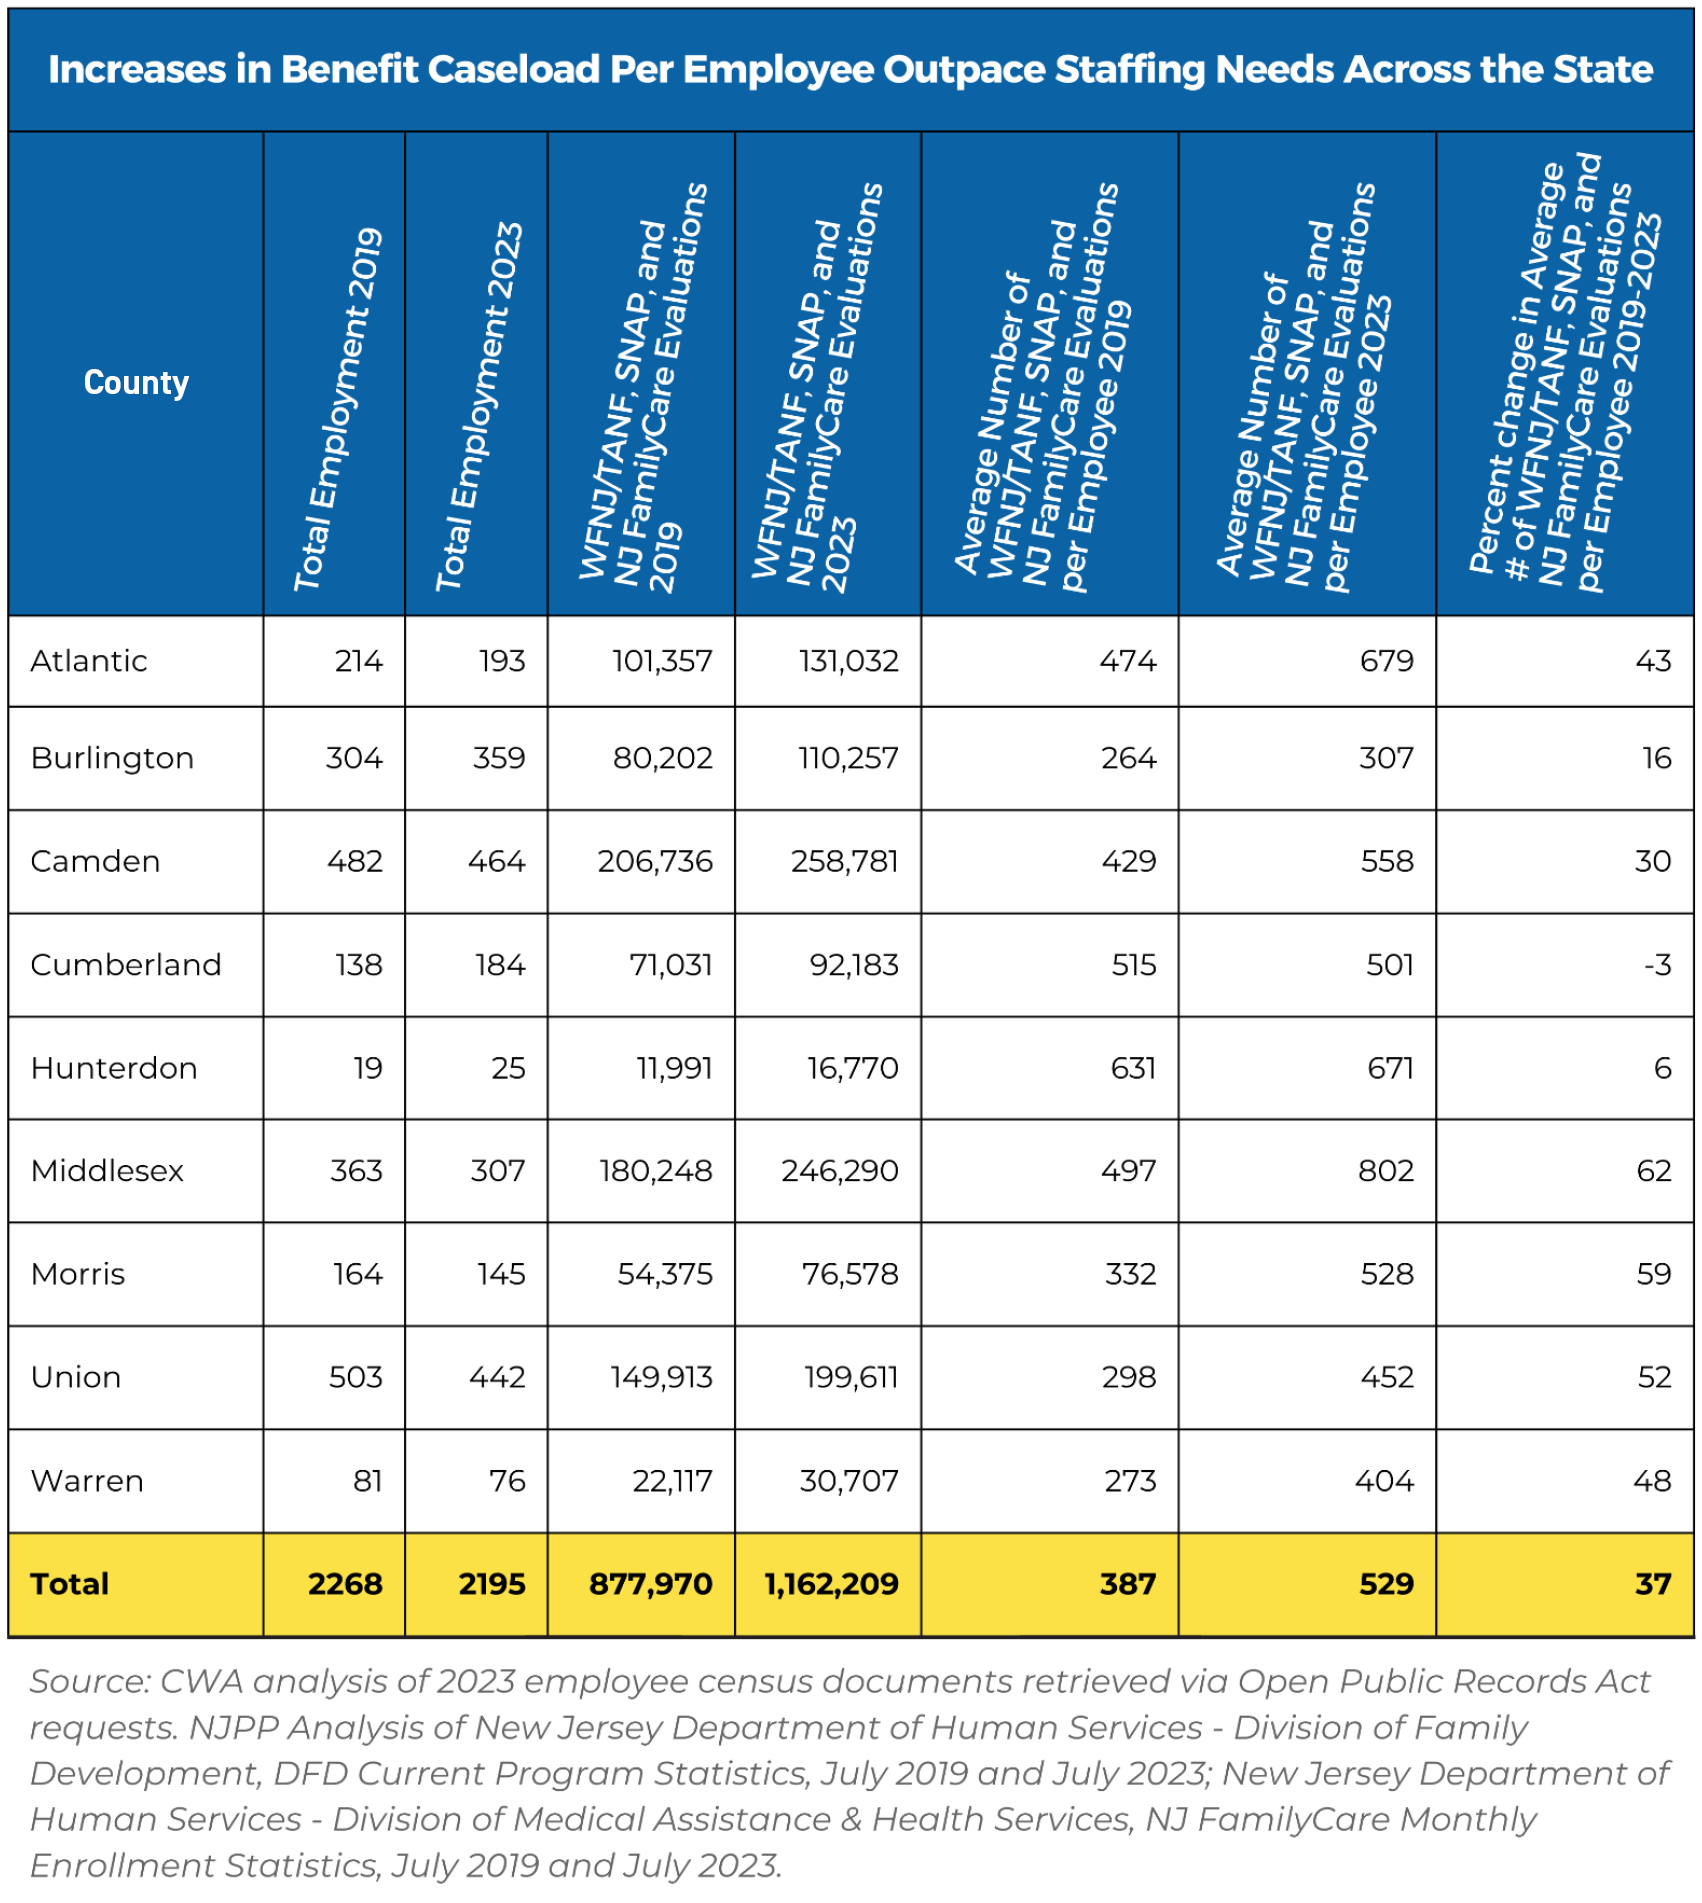
Despite the increasing need for assistance amongst Garden State residents, staffing levels at county agencies in New Jersey have fallen, putting more strain on workers. Currently, an estimated 5,000 to 6,000 people work for county social service agencies across the state, but these numbers are declining.[v] Across nine agencies (Atlantic, Burlington, Camden, Cumberland, Hunterdon, Middlesex, Morris, Union, and Warren) that provided current and historical employment data through open records requests,  the number of staff fell 3.2 percent between 2019 and 2023, from 2,268 to 2,195.[vi] At the same time, the number of WFNJ/TANF, SNAP, and NJ FamilyCare evaluations for which those workers were responsible increased by 32.4 percent, from 877,970 in 2019 to 1,162,209 in 2023.[vii] As caseloads per employee rise, turnover can accelerate, and hiring can become more difficult, especially when salaries and benefits do not rise to match the value of each employee’s work.

Staffing Levels Have Fallen, Despite More Residents Seeking Asistance
Source: CWA analysis of 2023 employee census documents retrieved via Open Public Records Act requests. NJPP Analysis of New Jersey Department of Human Services – Division of Family Development, DFD Current Program Statistics, July 2019 and July 2023; New Jersey Department of Human Services – Division of Medical Assistance & Health Services, NJ FamilyCare Monthly Enrollment Statistics, July 2019 and July 2023.

Increases in Benefit Caseload Per Employee Outpace Staffing Needs Across the State

This issue is not contained in a particular county or region. From Atlantic County to Morris County, agencies have failed to maintain sufficient staffing levels. The nine-county average of WFNJ/TANF, SNAP, and NJ FamilyCare evaluations completed by each employee went from 387 in 2019 to 529 in 2023, a 28 percent increase.[viii] Because of similar trends in poverty and budget issues, this pattern likely carries across most of the state.

Fewer employees, each with more cases assigned, means that each employee has less time to help each person and, in some instances, becomes significantly delayed. Complex application and documentation processes and less time available to help those in need increases the likelihood that residents are wrongly turned away or denied benefits. 

Low Pay and Poor Work Environments Lead to Understaffing

“The expense of everyday living does not equate to my paycheck. I am robbing Peter to pay Paul. Due to the lack of pay and increase in health insurance.” – Essex County social service worker

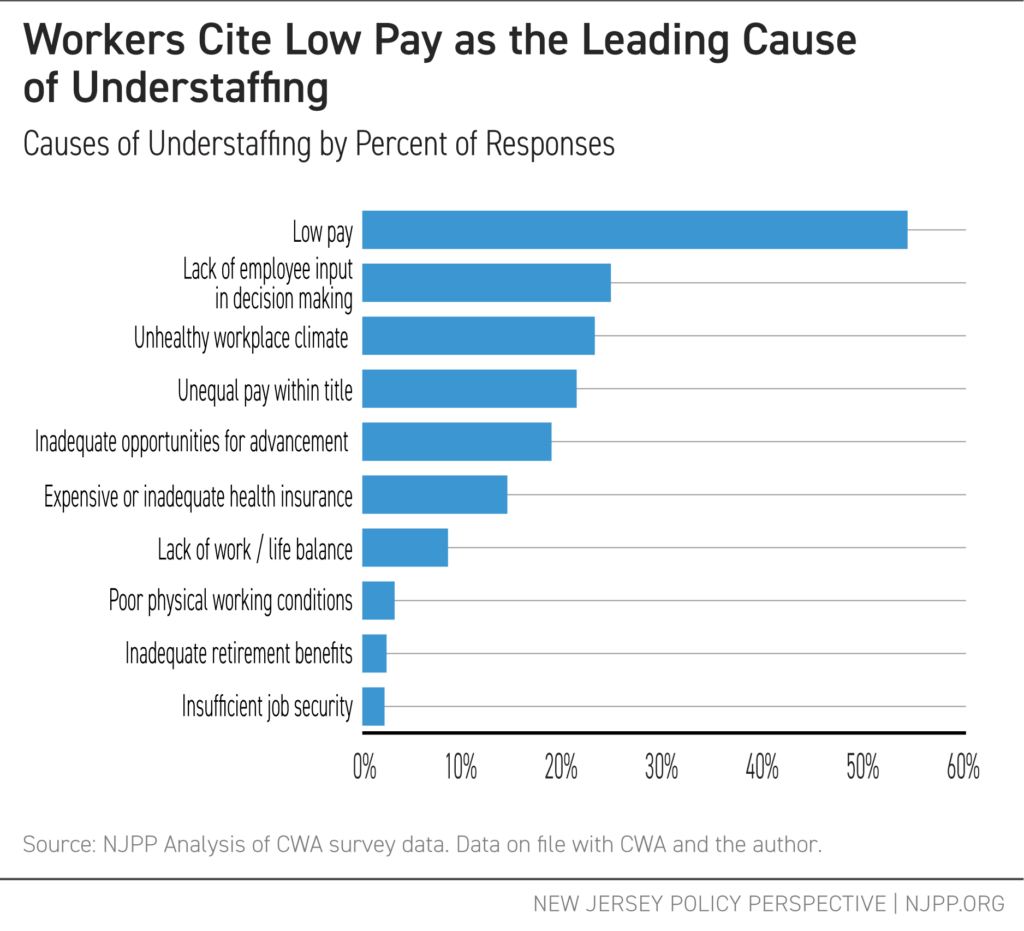
Where workers are undervalued, maintaining adequate staffing levels becomes impossible. Low wages that do not keep pace with the cost of living mean that employees struggle to pay bills and support their families. This makes recruiting larger numbers of staff more difficult. When asked to identify the top two causes of understaffing at their agencies, over half of survey responses received in New Jersey emphasized low pay.

Workers Cite Low Pay as the Leading Cause of Understaffing

In addition to low pay, several other issues — such as a lack of empowerment to provide input in the policies and decision-making, unhealthy workplace climates, and unequal pay across workers with the same title — were all mentioned by nearly 1 in 4 respondents. Additionally, issues such as expensive or inadequate health insurance are closely tied to low pay. Follow-up survey responses emphasized that the combination of low pay and expensive health coverage go hand-in-hand.[ix]

"Our pay is not even close to keeping up with the cost of living increases. The healthcare increases are extreme. I shouldn't be on the verge of homelessness, when trying to serve the homeless, myself." - Camden County Social Service Worker

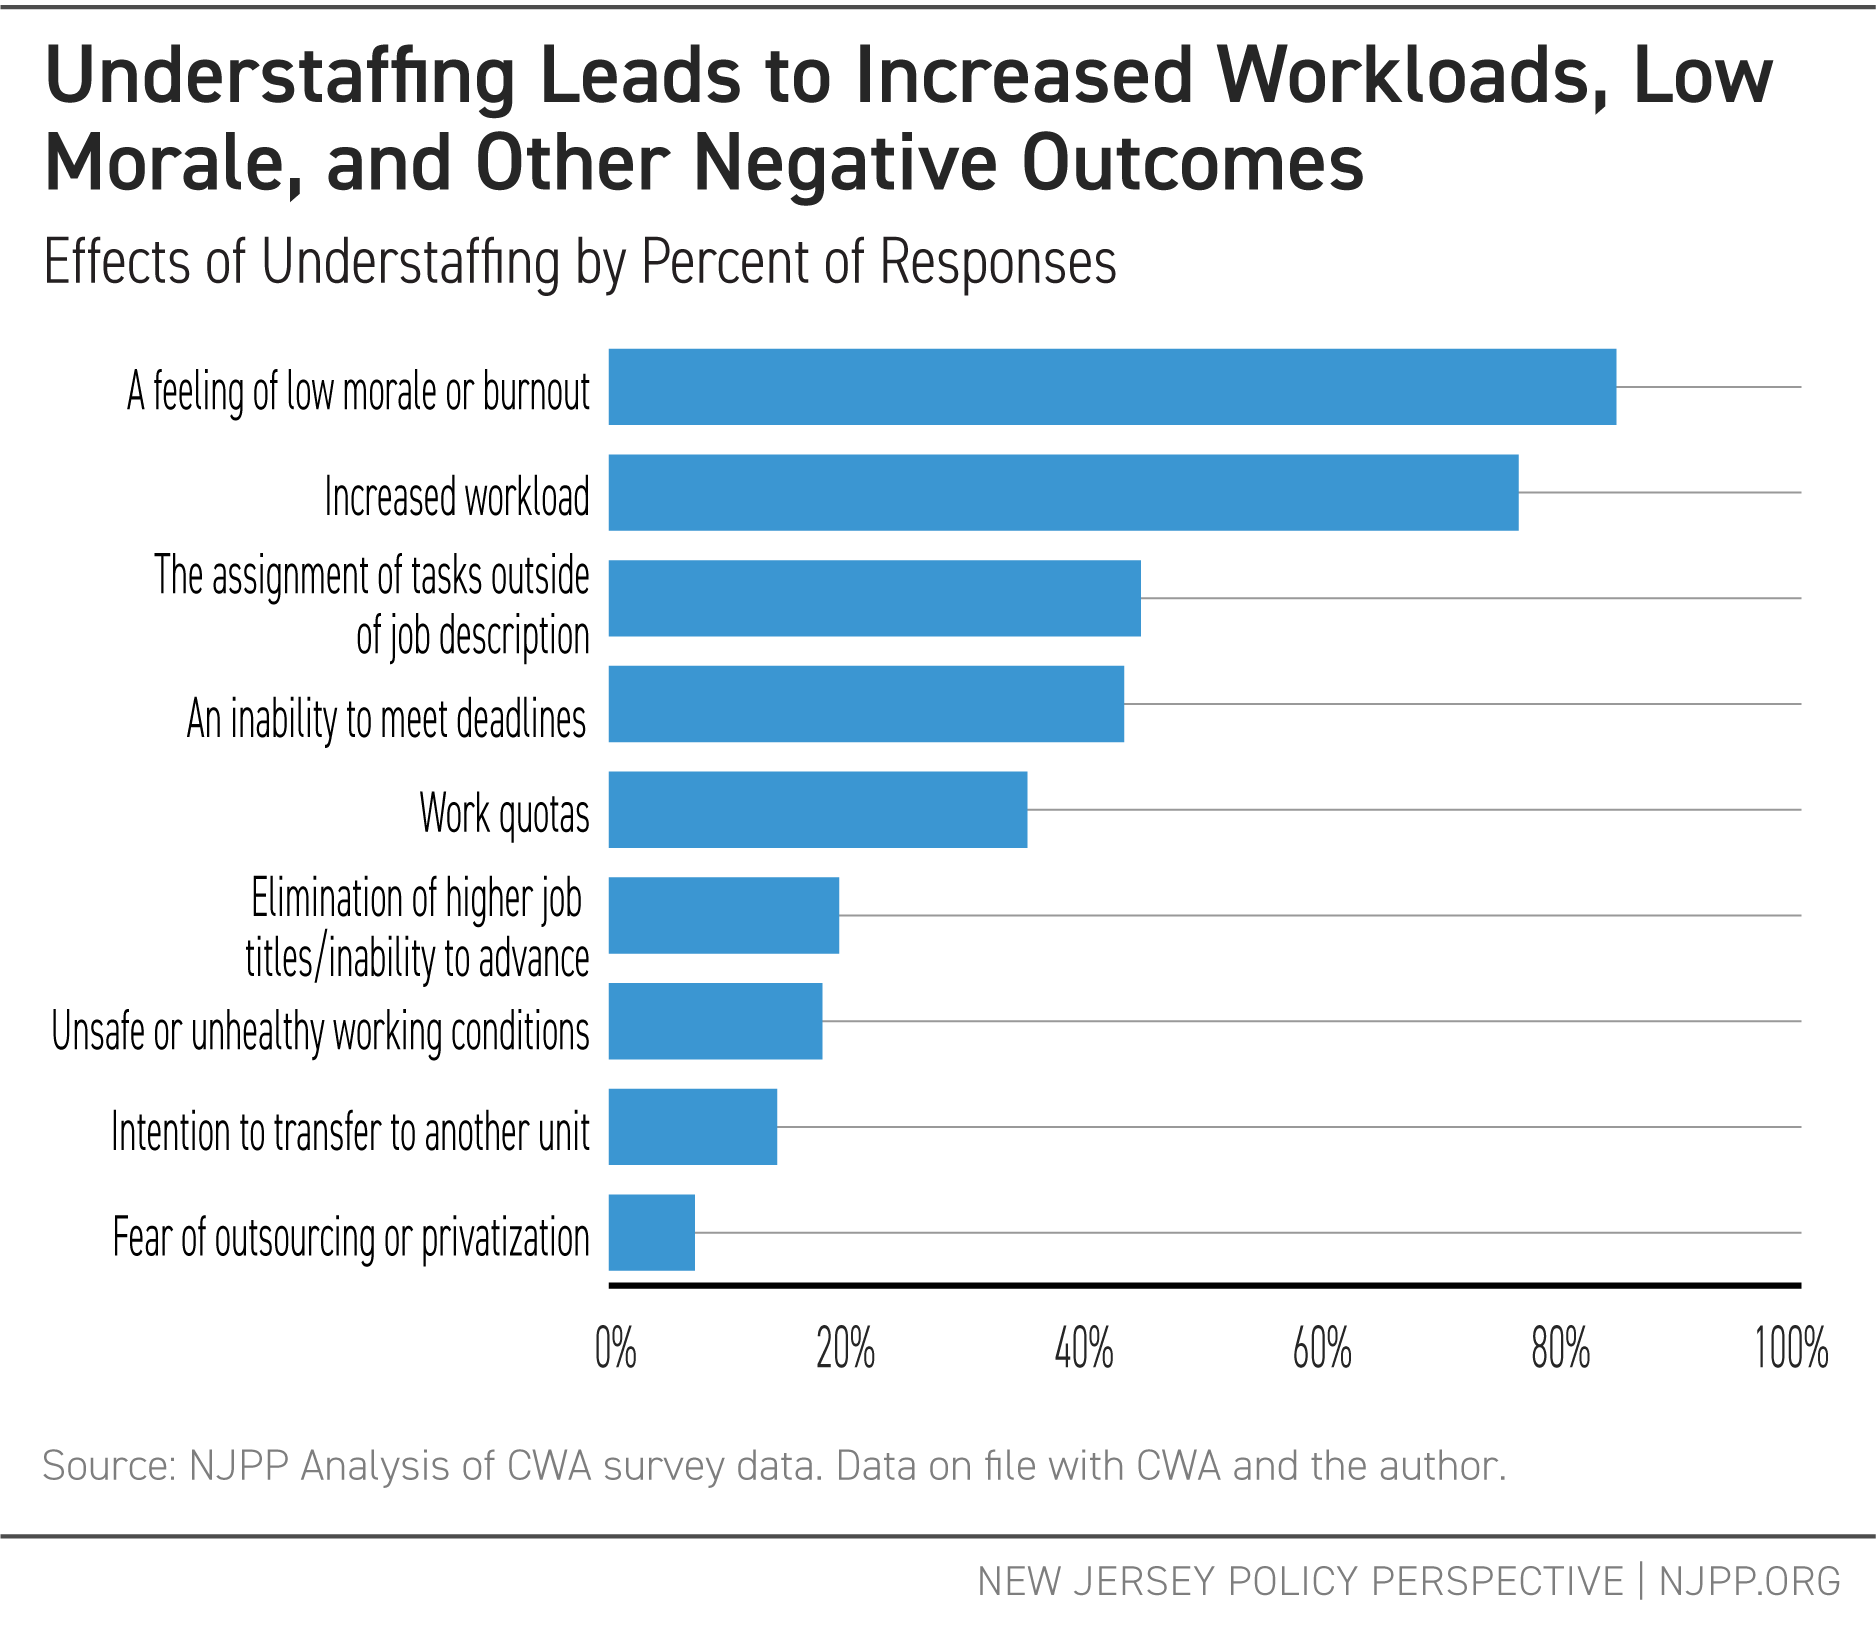
Deteriorating understaffing issues mean that workloads continuously increase beyond the staff’s capacity. As a result, they experience low morale and burnout much sooner, leading to high turnover rates and difficulty in hiring new staff. This further worsens the understaffing crisis, creating a snowball effect on the agencies’ capabilities to carry out their work successfully. As one Camden County employee shared: “We are being unfairly overworked/understaffed while constantly being told that we need to get things done on time. All while not having a decent raise, which puts morale at an all-time low. Some of us need to miss work due to mental stress alone, which then hurts clients. We need action soon or I don’t see anything getting better.”

Understaffing Leads to Increased Workloads, Low Morale, and Other Negative Outcomes

Only by increasing pay to meet the cost of living and improving work environments can county social service agencies better attract and retain employees to meet staffing needs.

Lack of Sufficient Staffing Delays and Denies Residents Assistance

“The workload has increased tremendously and the loss of staff has gotten worse. There is no time to do all that is required, and if you are not donating your time without compensation, then you can’t keep up.” – Middlesex County Social Service Worker

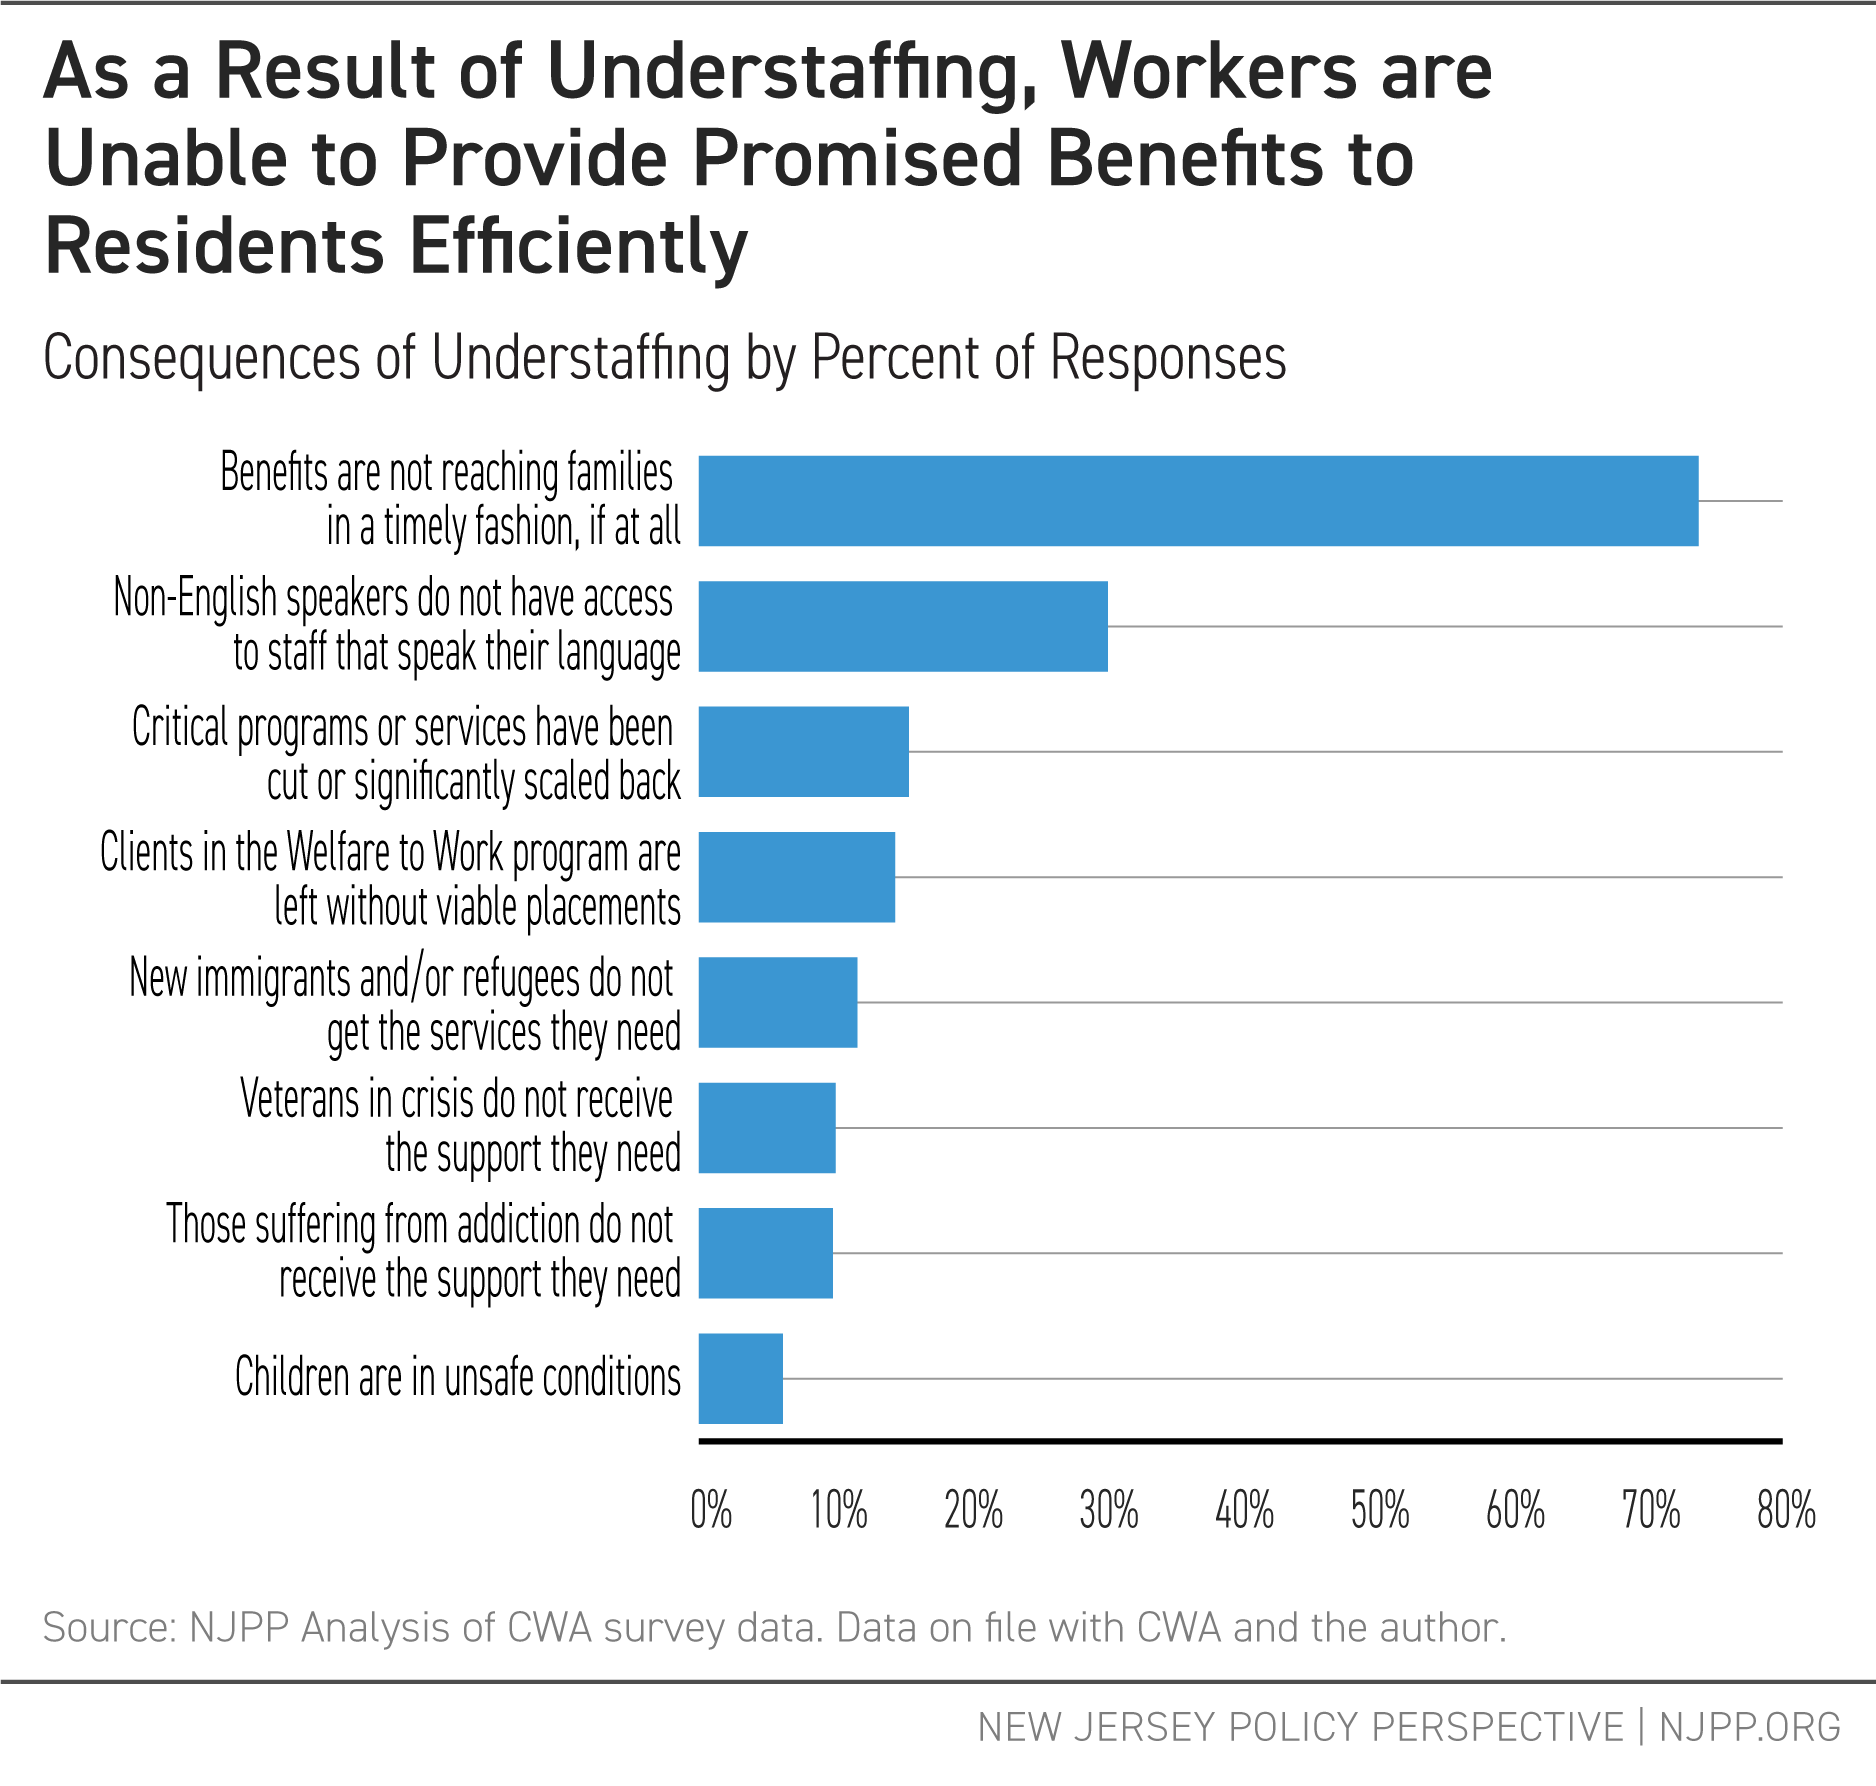
As workers are saddled with larger workloads, they struggle to meet the timelines necessary to get people the benefits they need. Nearly three-quarters of respondents in the survey cited the inability to provide benefits for families promptly as the main consequence of their agency’s understaffing.

As a Result of Understaffing, Workers are Unable to Provide Promised Benefits to Residents Efficiently

"Applications are 6+ months old. People aren't getting timely services. Elderly and sick people can't go to the doctor because we don't hire enough people." - Monmouth County Social Service Worker

When agencies providing critical support services are short-staffed, the quality of relationships and support for residents also suffers. This is particularly important in social services, as many clients are undergoing vulnerable and difficult experiences. A Camden County employee lamented: “It’s been quantity over quality for as long as I can remember. The “case bank” has stripped the customer of their caseworker, and for some, the caseworker was a relied-on individual in a time of need, who was familiar with their struggle(s). There is no personalization anymore.”

In addition to the inability to provide benefits in a timely manner, nearly one-third of workers also stated that those residents who primarily speak a language other than English do not have the support they need because of the lack of capacity. “In my building, there is only one bilingual worker. Oftentimes, the receptionist is left struggling to communicate with Spanish speaking clients and to find someone to serve them,” wrote a clerk in Ocean County. “The lack of bilingual workers leaves critical communication needs unmet, especially in field duties such as home visits and client interviews,” noted another worker from Ocean County.

With hundreds of thousands of residents across diverse communities in need of assistance, barriers to social service programs can prevent families from escaping poverty and worsen economic, health, and racial inequities. If New Jersey truly wants to be a leading state in providing generous benefits for residents and a political and economic environment where all residents can thrive, state leaders need to focus on improving the implementation of existing programs, as well as creating new programs and services. Increased benefits will not reach families in need without adequate delivery of services.

Policy Recommendations

While this report identifies challenging issues in New Jersey’s county social service agencies, recent and ongoing collective bargaining processes at the local level offer opportunities to make significant improvements. New Jersey’s public sector bargaining framework allows employees with expertise on the conditions on the ground to negotiate with their employer to improve working conditions, staffing levels, and the quality of work and service across the board. Recent examples from localities such as Ocean County — which has seen increased staffing, decreased turnover, and improved workloads after pay increases — provide a foundation for progress.[x]

In 2024 and 2025, the majority of social service agencies and their unions across the state are either scheduled to start bargaining or are currently engaged in ongoing negotiations.[xi] Through these collective bargaining processes and broader policy changes, Garden State decision-makers and workers must urgently come together to implement three main recommendations from this report’s findings.

Increase Pay

Over 86 percent of survey respondents who said they were considering leaving the job stated that a pay increase of at least 10 percent would help to convince them to stay at their job.[xii] Several respondents reported that more than 10 percent would be needed, particularly with concerns about the increased cost of living and health insurance.[xiii] By increasing pay to meet the cost of living, county social service agencies can improve working conditions for employees and attract more residents to agency jobs.

Improve and Enforce Staffing Ratios

Nearly half (48 percent) of survey respondents reported that a fully staffed department would help convince them to stay at their job.[xiv] Requiring stronger staff-to-program beneficiary ratios and enforcing those ratios would help ensure that the county social service agencies can adequately perform their jobs.

Improve Work-Life Balance for Workers

While the staffing ratios and higher pay will help, improving or providing other benefits — such as child care support, greater flexibility for attending doctor appointments during work hours, and increasing the number of vacation and sick days — will further improve work-life balance to retain workers and attract more to the agencies.

Appendix A: Survey Research Methods

Over 3,000 employees at 14 county social service agencies are represented by the Communications Workers of America (CWA), working under collective bargaining agreements. Social service agency employees represented by CWA coordinate statewide through the CWA New Jersey Welfare Council (Welfare Council). In the spring of 2023, the Welfare Council designed and distributed a survey to measure worker concerns about staffing levels, pay, benefits, and service provision across the state. Between May and August 2024, the survey was sent to all CWA members at 11 of the 21 social service agencies, and 592 employees completed the survey.

Survey outreach was designed to capture a diverse sample of social service agency workers, including employees with a range of job titles and demographic backgrounds, and who work at a mix of large, medium, and small agencies in urban and rural contexts. In addition to surveys, semi-structured interviews with three workers from each agency were conducted to understand quantitative and qualitative survey data better.

Survey participants are racially and ethnically diverse. Of the 492 who answered questions about race and ethnicity (83 percent of the total), 48 percent are White, 33 percent are Black or African American, 9 percent are Multiracial, and 5 percent are Hispanic. Five hundred (84 percent) respondents answered the question about gender: 82 percent are women, and 18 percent are men, reflecting the gender demographics in the social service sector as a whole. For a more detailed chart of survey responses by agency, job title, race/ethnicity, and gender, please contact CWA.

Survey Questions:

  1. Which County Welfare Agency do you work for?
  2. Which programs do you work on (select all that apply)?
  3. Title
  4. If you selected “other” for title above, please share your job title.
  5. Years of Service
  6. Are you a full-time or a part-time employee?
  7. What issues are you the most concerned about in your workplace? Please select the top 3.
  8. Please rate your level of agreement with the following statement: “My department is currently understaffed.”
  9. How long ago did understaffing start?
  10. What do you believe are the two (2) primary drivers of understaffing in your department? Please select only the top 2.
  11. Please rate your level of agreement with the following statement: “My workload interferes with my work/life balance.”
  12. How long ago did your workload get so high that it began to interfere with your work/life balance?
  13. Have you experienced any of the following outcomes as a result of understaffing (select all that apply)?
  14. Has understaffing impacted your department’s ability to provide quality services?
  15. Has understaffing affected the quality of services in your department in any of the following ways?
  16. Please provide specific examples as to how understaffing has impacted the quality of services you are able to provide to the clients.
  17. In the past year, have you considered leaving your job for reasons other than retirement?
  18. What are the top 2 concerns affecting your consideration to leave?
  19. If you are still considering leaving your position, would any of the following convince you to stay?
  20. What is your race?
  21. What is your ethnicity?
  22. What is your gender?

End Notes

[i] New Jersey Department of Human Services, Division of Family Development, County Social Service Agencies, 2024. https://www.nj.gov/humanservices/dfd/counties/

[ii] Note: Throughout the report, “WFNJ/TANF” refers to the Temporary Assistance for Needy Families program under the umbrella of Work First New Jersey, in order to differentiate it from the numbers for General Assistance or Emergency Assistance under Work First New Jersey. Numbers from: NJPP Analysis of New Jersey Department of Human Services – Division of Family Development, DFD Current Program Statistics, September 2024. https://nj.gov/humanservices/dfd/news/cps.html

[iii] New Jersey Policy Perspective, Outdated and Ineffective: Why New Jersey Needs to Update Its Top Anti-Poverty Program, 2024. https://www.njpp.org/publications/report/outdated-and-ineffective-why-new-jersey-needs-to-update-its-top-anti-poverty-program/; Center on Budget and Policy Priorities, Policy Basics: Temporary Assistance for Needy Families, 2022. https://www.cbpp.org/research/family-income-support/policy-basics-an-introduction-to-tanf; New Jersey Policy Perspective, Promoting Equal Opportunities for Children Living in Poverty, 2020. https://www.njpp.org/publications/report/promoting-equal-opportunities-for-children-living-in-poverty/

[iv] For detailed research methods and information about the demographics of the survey respondents, please see Appendix A.

[v] The total social service employment estimate is based on CWA analysis of the following: (1) 2023 total employment data provided by 16 of the 21 social service agencies in response to OPRA requests in 2023, and (2) For the missing 5 counties: estimates were established based on average 2023 employment at agencies with similar poverty rates/benefit participation rates.

[vi] In 2023, the Communications Workers of America obtained employee census snapshots pulled on June 30th, 2019 and June 30th, 2023 via public records requests from nine New Jersey county social service agencies. Records were obtained from Atlantic, Burlington, Camden, Cumberland, Hunterdon, Middlesex, Morris, Union, and Warren Counties. Collectively, these nine counties supported a third of the total people receiving benefits from WFNJ/TANF, SNAP, and NJ FamilyCare in New Jersey in 2019 and 2023.

[vii] NJPP Analysis of New Jersey Department of Human Services – Division of Family Development, DFD Current Program Statistics, July 2019 and July 2023. https://nj.gov/humanservices/dfd/news/cps.html

[viii] Lists of current vacancies by agency were also obtained through OPRA in 2023. Vacancy data suggest that even in the counties where short staffing is not as severe, there are persistent challenges filling vacancies.

[ix] NJPP Analysis of CWA survey data. Data on file with CWA and the author.

[x] CWA Local 1088, representing employees at the Ocean County Social Services Board, worked productively with management to negotiate a historic contract in 2024. The contract was ratified in June of 2024 and, among other improvements, it increased starting pay across all job titles by $3 an hour. Between June and November, at least 60 new employees have been hired, turnover has decreased, and workloads are improving. The contract also includes provisions for an additional $2/hour increase to starting pay by 2025. This progress in Ocean points to the importance of increasing pay and including the people who do the work in robust negotiations to improve New Jersey’s social service landscape. Source: Interview with Steven P. Hernandez, Ocean County Social Services Board, Chapter VP, CWA Local 1088, November 2024.

[xi] NJPP review of social service agency collective bargaining agreements and expiration dates available publicly or by request. Note: public sector bargaining agreements in NJ are collected by and made publicly available by Public Employment Relations Commission (PERC): https://www.nj.gov/perc/conciliation/contracts/

[xii] NJPP Analysis of CWA survey data. Data on file with CWA and the author.

[xiii] NJPP Analysis of CWA survey data. Data on file with CWA and the author.

[xiv] NJPP Analysis of CWA survey data. Data on file with CWA and the author.

Fair and Square: Changing New Jersey’s Tax Code to Promote Equity and Fiscal Responsibility

New Jersey is a rich state with high median wages, high concentrations of wealth, and high productivity.[i] But that wealth does not translate into prosperity for all — more than 1 in 8 children live in poverty,[ii] and key public investments, including schools, public transportation, and municipal services, have faced decades of underfunding and underinvestment. The top 1 percent of households by income take home more than 24 times more than the bottom 99 percent.[iii] Meanwhile, economic growth is increasingly concentrated in multinational corporate profits instead of workers, deepening a system of haves and have-nots.[iv] This inequality exacerbates racial economic divides, with Black and Hispanic/Latinx workers paid lower wages and holding less wealth than white households.[v]

New Jersey can counter these trends, sustain public investments, and reduce income concentration in wealthy households and corporations, by strengthening its progressive tax system. In this system, wealthier individuals pay a higher tax rate, while those with lower incomes pay less.[vi] This approach reflects societal values that those who have benefited the most from our economic systems should contribute a higher percentage of their income and pay back their fair share to the rest of the state, while those with fewer financial resources should pay a smaller share.

Now is the moment to address tax fairness, as more revenue will be needed to improve affordability for the state’s residents. Unfortunately, the state’s revenues have not kept pace with existing obligations, in part because of years of underinvestment in pensions, deferred maintenance on New Jersey Transit,[vii] and failure to fully fund the school funding formula.[viii] These choices led to irresponsible budgeting, which mortgaged the state’s future for short-term budget patches.[ix] As a result, the state is now running a structural deficit, meaning it collects less in revenue than it spends on programs and services.[x] As these longer-term fiscal projections from an independent group of New Jersey budget experts show in the graph below, this deficit will expand in the years to come, draining the state’s surplus and hampering new investments.[xi]
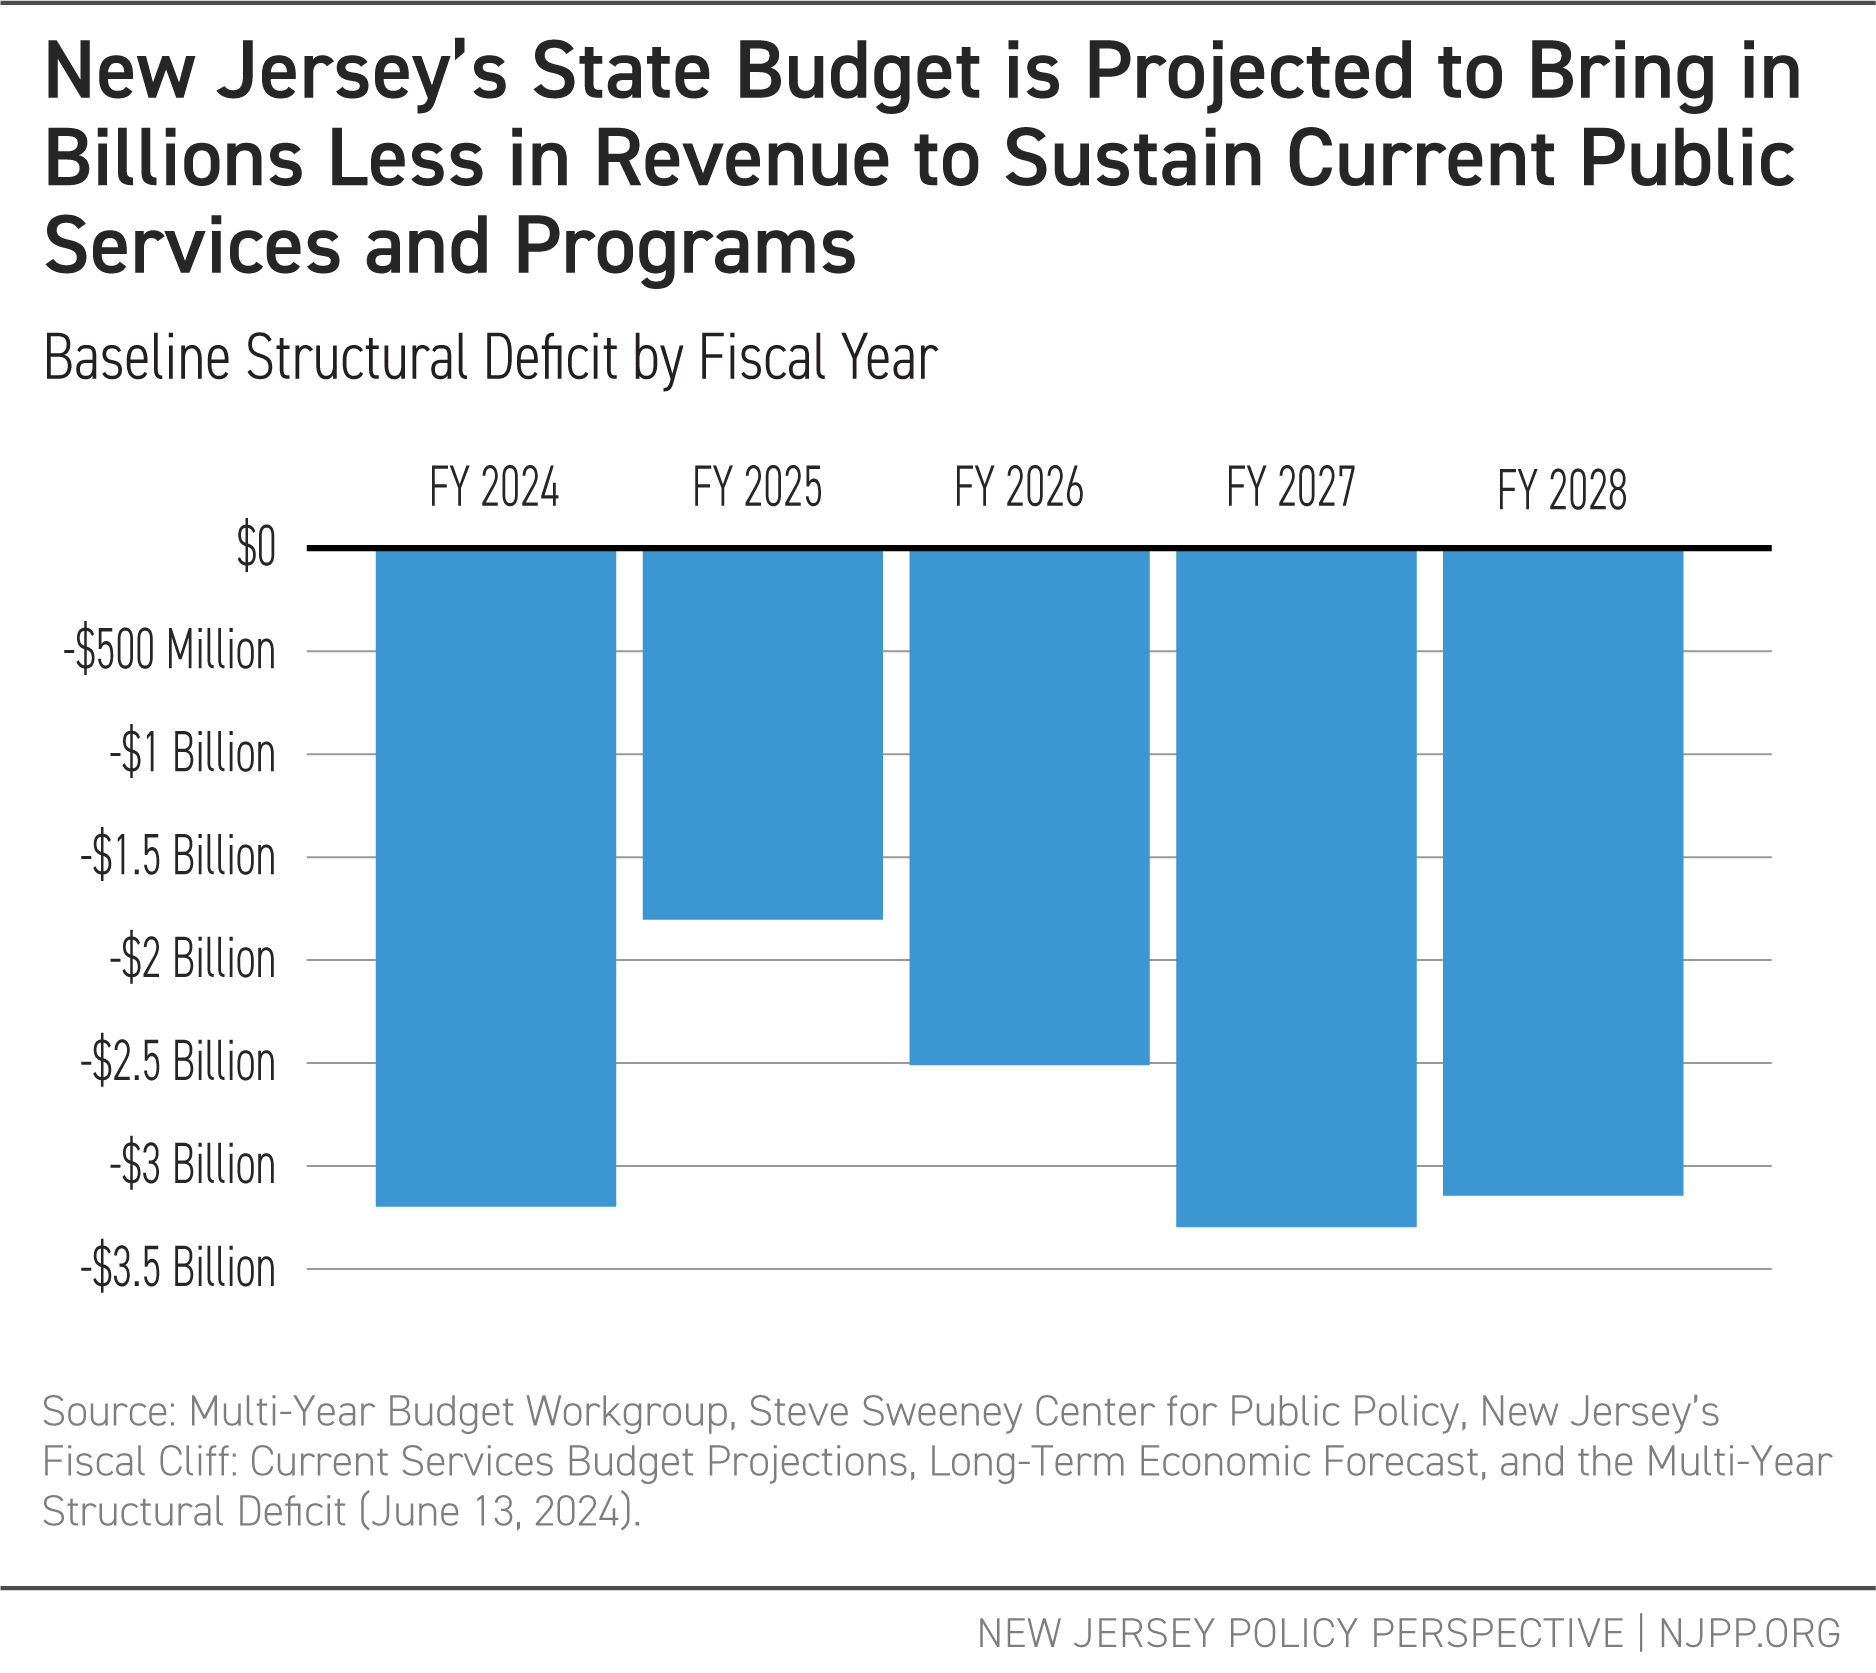
New Jersey's State Budget is Projected to Bring in Billions Less in Revenue to Sustain Current Public Services and Programs

New Jersey’s need for tax reform has additional urgency because of looming threats to the national landscape. Federal tax law changes from 2017 gave substantial tax cuts to wealthy individuals and corporations starting in 2019, but those changes may become permanent in 2025 when those provisions expire.[xii] Expiring federal funds from pandemic-era aid for states will create fiscal cliffs for critical programs such as New Jersey Transit, which has already led to fare increases and the end of popular fare programs.[xiii] The state’s economy needs increased investment in public services at exactly the time when federal support for progressive tax policy and aid to states is declining.

To meet these policy goals, this report lays out a range of revenue-raising options that meet key criteria:

  • Raise new revenues for the state
  • Are based on former or current tax systems such as gross income, sales, or corporate taxation
  • Increase the overall progressivity of the state’s tax system
  • Improve racial and economic equity by closing existing income and wealth disparities.


The full package of revenue increases outlined in this report would raise nearly $4 billion annually for the state’s budget — enough to make all school meals free, restore state aid to schools getting cuts, and cover the state’s entire deficit. The full package includes the state’s major revenue streams, including gross income, sales, corporate business, and inherited wealth taxes, identifying targeted changes to generate much-needed funding without placing those costs disproportionately on the people who need the most help:

  • Income tax: Revising the income tax to add brackets for higher-income residents, including new rates on earners over $2 million, $5 million, and $10 million in income, while expanding working-family tax credits such as the Child Tax Credit and Earned Income Tax Credit to ensure that low- and moderate-income households benefit from the tax changes.
  • Inherited wealth tax: Reforming inherited wealth taxes to reduce unearned wealth transfers and tax large inheritances.
  • Sales tax: Restoring the sales tax to 7 percent, along with modernizing services exemptions, which have excluded accounting, advertising, engineering, and other high-end services from taxation.
  • Realty transfer fee: Adding two percentage points to the existing 1 percent realty transfer fee on home sales over $1 million and four percentage points on sales over $2 million.
  • Corporate tax: Requiring large multinational corporations to report profits from overseas subsidiaries, forcing them to stop offshore profit-shifting.
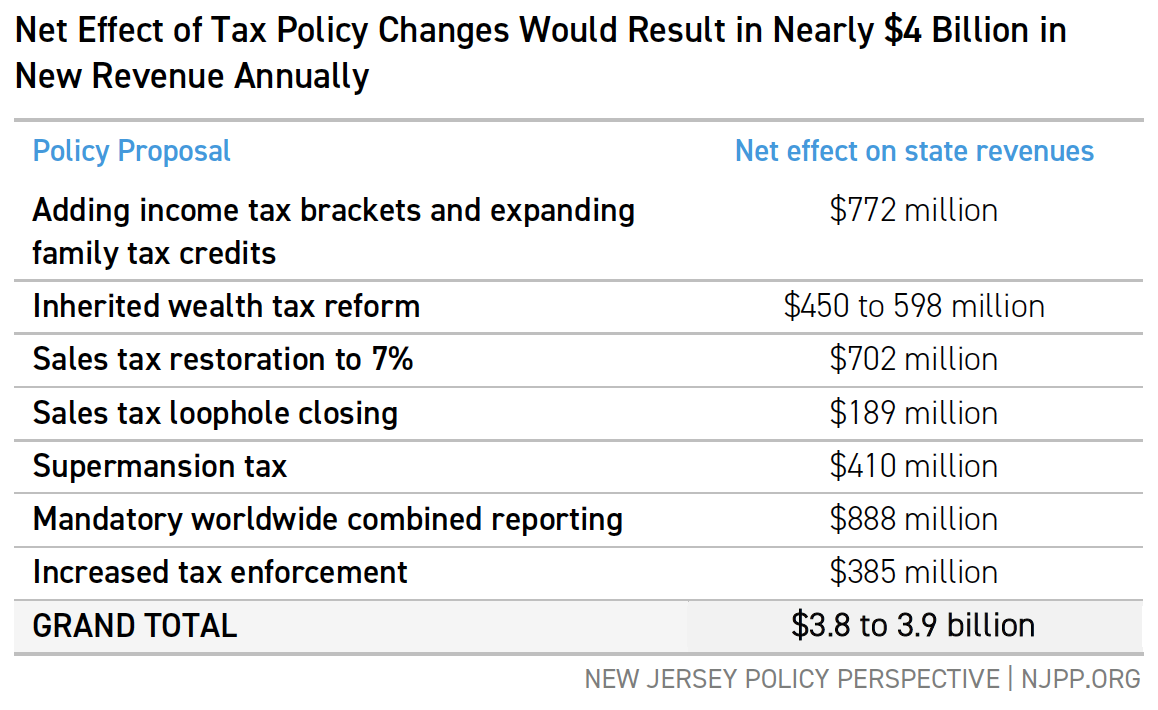
 

Net Effect of Tax Policy Changes Would Result in Nearly $4 Billion in New Revenue Annually Right-Size the Income Tax: Raise Rates at the Top, Lower Them at the Bottom

Proposal Overview

Making New Jersey’s income tax more progressive would increase revenue and improve affordability for working- and middle-class households. This proposal would add new tax brackets for incomes over $2 million, $5 million, and $10 million, affecting only a tiny fraction of taxpayers but targeting a significant portion of the state’s wealth. Additionally, it would expand the Earned Income Tax Credit (EITC) to 50 percent of the federal credit and make all workers who file taxes eligible to claim it. The Child Tax Credit (CTC) would also be expanded to $1,500, extending eligibility to children up to age 11. While the expanded working-family tax credits would reduce overall revenues, they would reduce income inequality and provide more financial support to low- and moderate-income households. Combined, this proposal would generate about $772 million annually.[xiv]

Raise Rates at the Top: Higher Marginal Income Tax Rates for High Earners

 New Jersey’s gross income tax applies different rates to income brackets, starting at 1.4 percent for the first $20,000 and reaching 10.75 percent for income over $1 million. This tax funds the state’s local property tax relief and serves as the primary revenue source for school aid.[xv] Even with these progressive elements, wealth continues to remain heavily concentrated in high-income households, with the top 20 percent of households taking home more than half the state’s total income.[xvi]

As shown in the table below, the proposal introduces new tax brackets at $2 million, $5 million, and $10 million, in addition to the existing 10.75 percent rate on earnings over $1 million, known as the “Millionaires Tax.” This adjustment alone would raise more than $1.2 billion for essential state programs while affecting less than 1 percent of households.[xvii] As wealth continues to concentrate at the top, a fair tax system should impose higher rates on the highest earners.
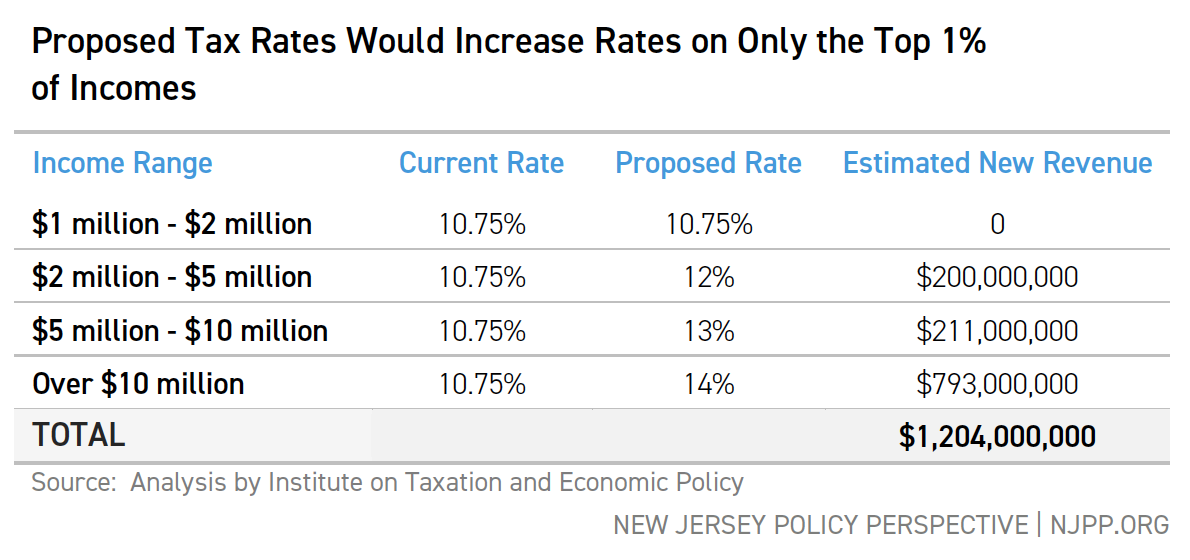
Proposed Tax Rates Would Increase Rates on Only the Top 1% of Incomes

As the state’s experience with the millionaires tax has shown, gross income tax receipts continue to climb despite the increasing marginal rates for those earning over $1 million and $5 million income.[xviii] Additionally, research shows that raising income tax rates on high earners has minimal impact on economic growth.[xix] High-income residents continue to call New Jersey home, and the number of tax filers with over $1 million in income increased by nearly 50 percent between 2019 and 2021.[xx]

Lower Rates at the Bottom: Expanding Working Family Tax Credits

New Jersey, like many states, uses its tax code to reduce poverty and improve affordability to working families and households to help them meet the cost of living by putting cash directly into their bank accounts to help cover the cost of living in the state.[xxi] In particular, the state funds two major tax credits that reduce poverty statewide: the state Earned Income Tax Credit (EITC)[xxii] and the state Child Tax Credit (CTC).[xxiii] As the name implies, the EITC pays workers back by enhancing their incomes, while the CTC provides cash rebates to families with children under age 6. The success of the federal Child Tax Credit has shown that even modest increases in credit amounts can dramatically reduce child poverty.[xxiv]

However, in New Jersey, both programs are still limited in their eligibility, weakening their antipoverty effects. The EITC, for example, is not available for workers without a Social Security number, excluding immigrant workers who pay and file taxes each year.[xxv] The CTC is only available for families with a child under age 6,[xxvi] despite research showing that children’s expenses grow as they age.[xxvii]

New Jersey should expand its Earned Income Tax Credit to 50 percent of the federal credit, and expand eligibility to all workers who file taxes, not just those with Social Security numbers.

Similarly, New Jersey should expand its Child Tax Credit to children ages 6 to 11 and increase the maximum benefit from $1,000 to $1,500 for children under age 6.[xxviii]

These changes would put hundreds of dollars back into families’ pockets, helping make New Jersey the best place to raise a family. These combined proposals would increase the progressivity of the tax code by providing an estimated $432 million to low- and moderate-income households. By amplifying the antipoverty effects of these critical lifelines, the state can help more households meet basic needs and raise the standard of living for working families. 
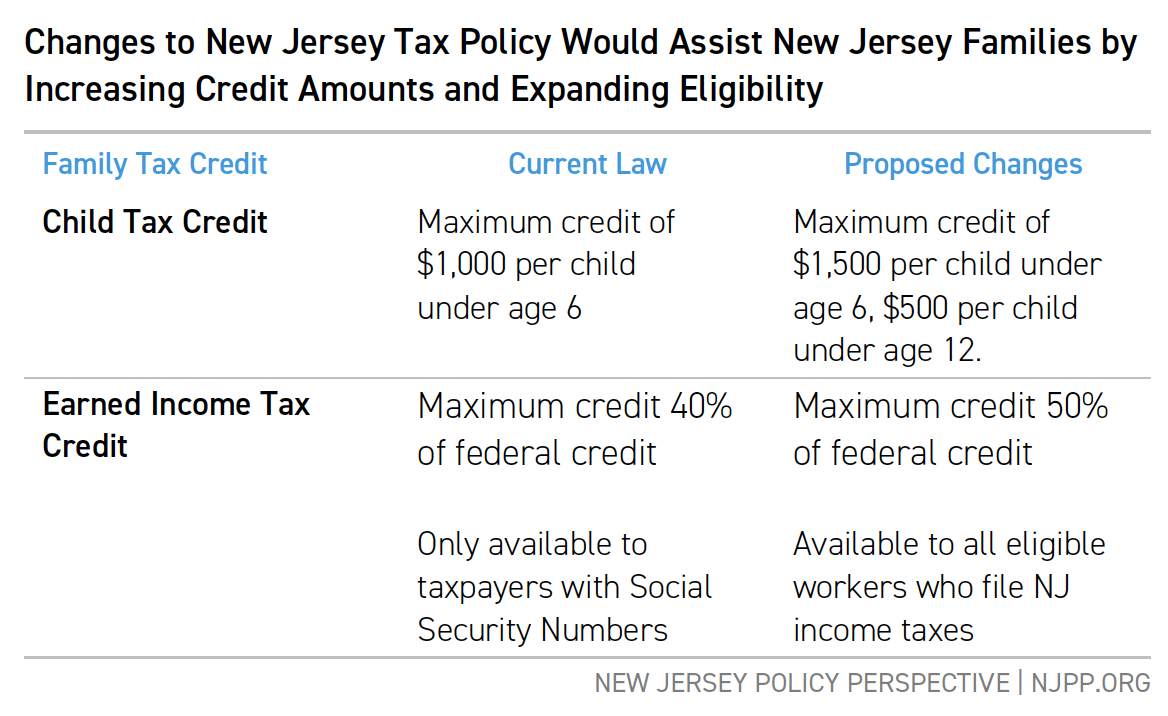
Net Effect of Combined Income Tax Proposals

Expanding tax credits for the lowest 40 percent of earners while raising income tax rates for the top 1 percent would make the state’s income tax system more progressive. This would generate additional income for the state while reducing the financial burden on its lowest-income residents, with no changes to rates for the majority of taxpayers.
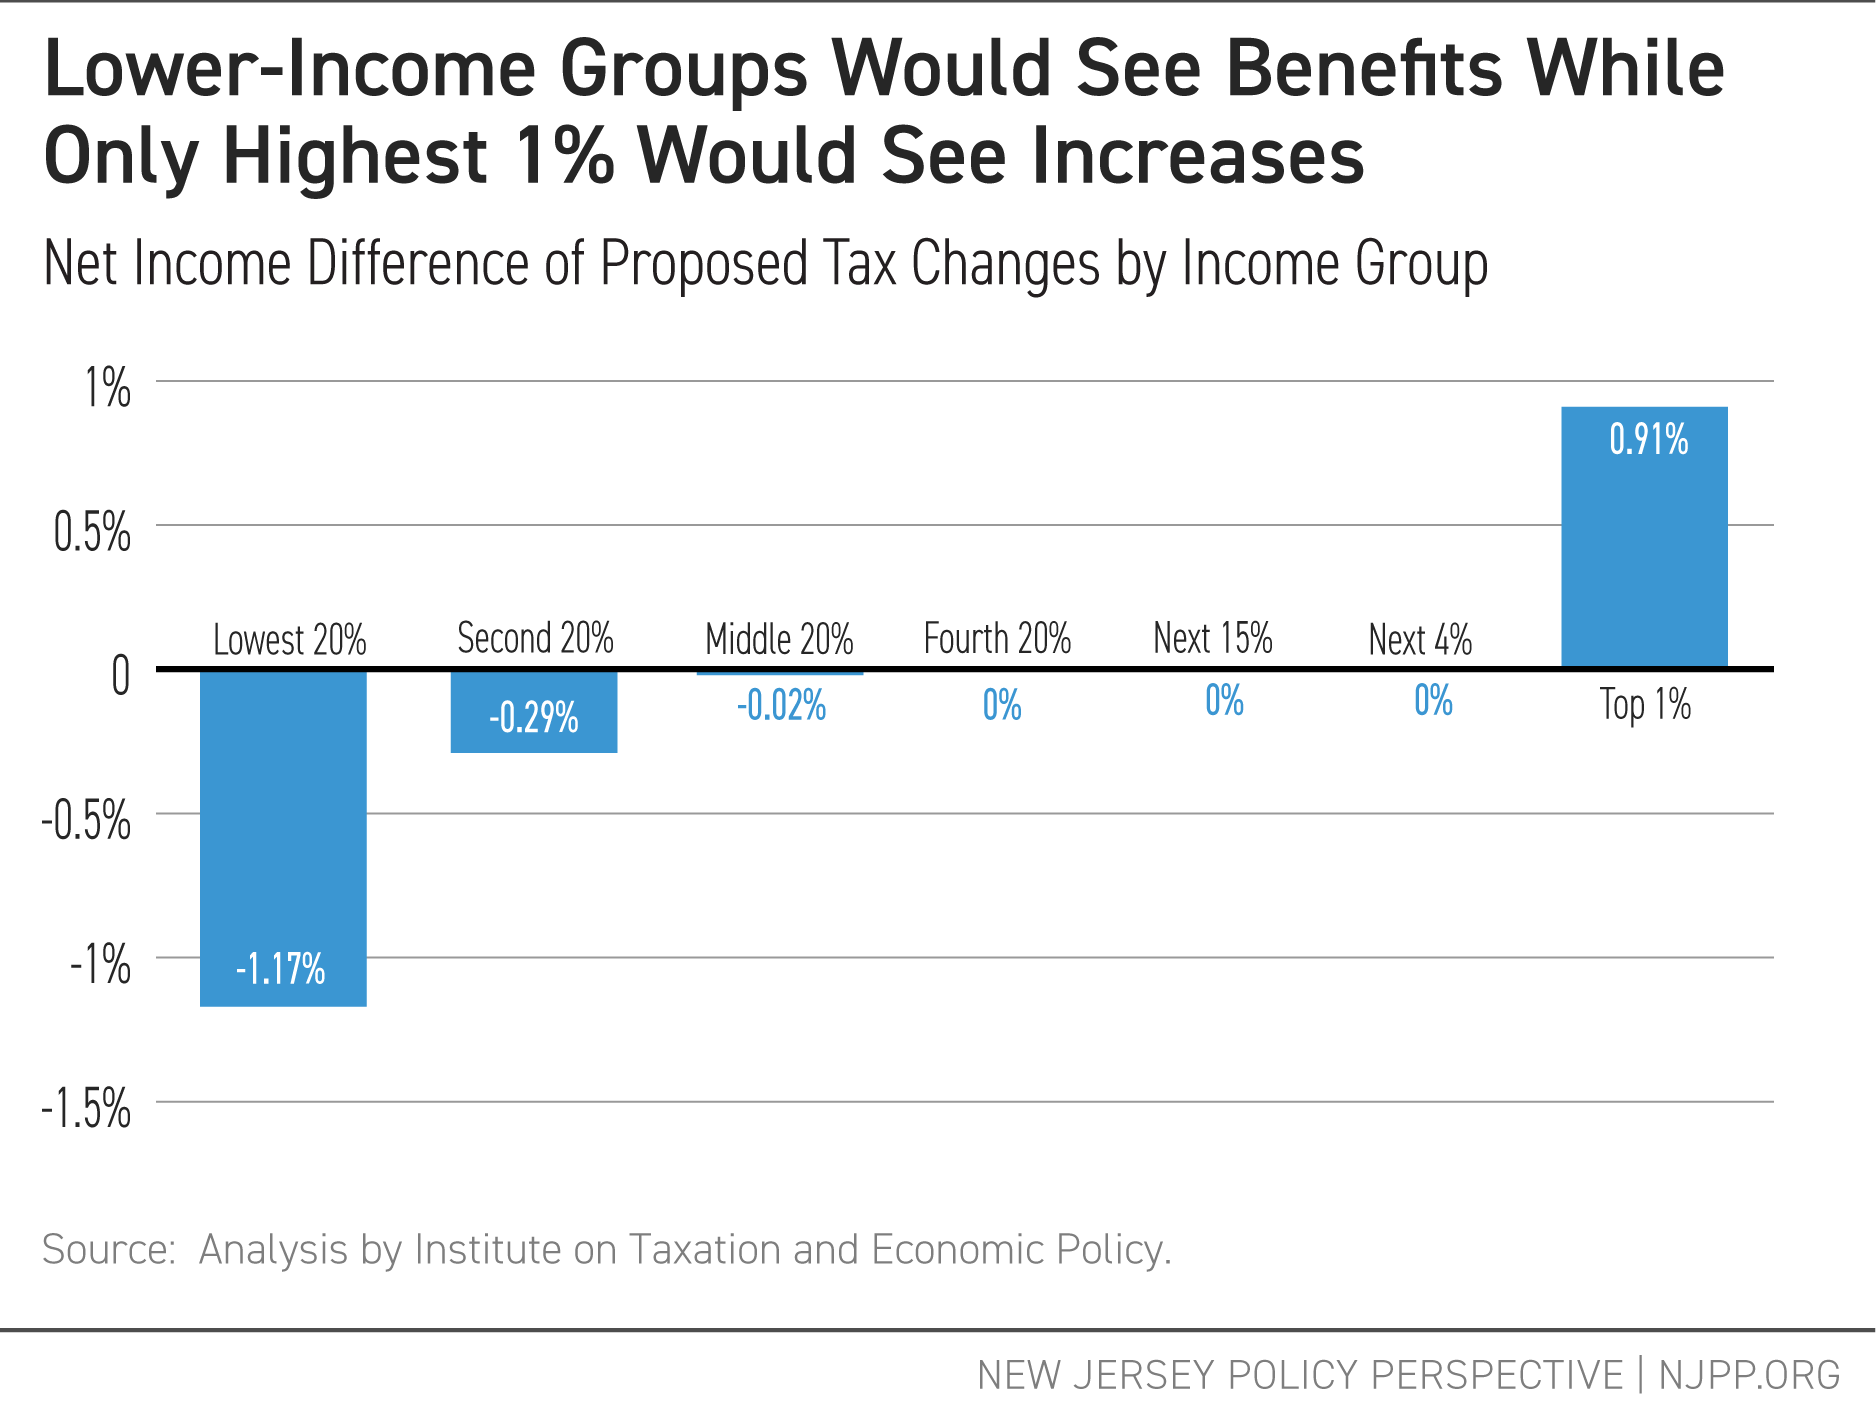
Lower-Income Groups Would See Benefits While Only Highest 1% Would See Increases

This combination of income tax changes would boost revenue and make the tax system fairer — a win-win for both New Jersey and its residents. The annual increase of $1.2 billion in revenue based on the bracket changes at the top of the income spectrum would be partially offset by the $432 million in reductions for low- and moderate-income households, resulting in a net revenue increase of $772 million. These tax law changes raise costs only for the wealthiest one percent while helping those who need the most help and funding critical state priorities.

Restore Taxes on Inherited Wealth Transfers

Proposal Overview

Taxation of intergenerational wealth is critical to reducing wealth inequality, shrinking the racial wealth gap, and equitably generating revenue. New Jersey currently has an inheritance tax which taxes the money collected by heirs, but the state no longer has an estate tax which taxes the overall value of the deceased person’s estate.[xxix] The proposed options aim to either eliminate inheritance tax exemptions or restore the estate tax, ensuring that intergenerational wealth transfers among the wealthiest households contribute to critical state needs. By implementing these changes, New Jersey could generate between $450 million and $598 million annually.[xxx]

Proposal Details

Currently, the inheritance tax includes major exemptions, covering lineal descendants (children, grandchildren, etc.), spouses, or lineal ancestors (parents, grandparents, etc.).[xxxi] Since the majority of inheritances come from parents or grandparents,[xxxii] these broad exemptions have resulted in most estate wealth being exempt from taxation entirely: Of the nearly $5.8 billion in total estate wealth in 2017, less than $2.5 billion (43 percent) was taxable.[xxxiii]

These loopholes run the risk of worsening wealth disparities and racial wealth inequality. Inheritances disproportionately benefit higher-income people, who compound their existing wealth while lower-income people are unlikely to receive any inheritance at all.[xxxiv] Across races, the difference in inheritance rates reinforce existing disparities: 30 percent of white families nationally report having received an inheritance, compared to only 10 percent of Black and 7 percent of Latinx/Hispanic families.[xxxv]
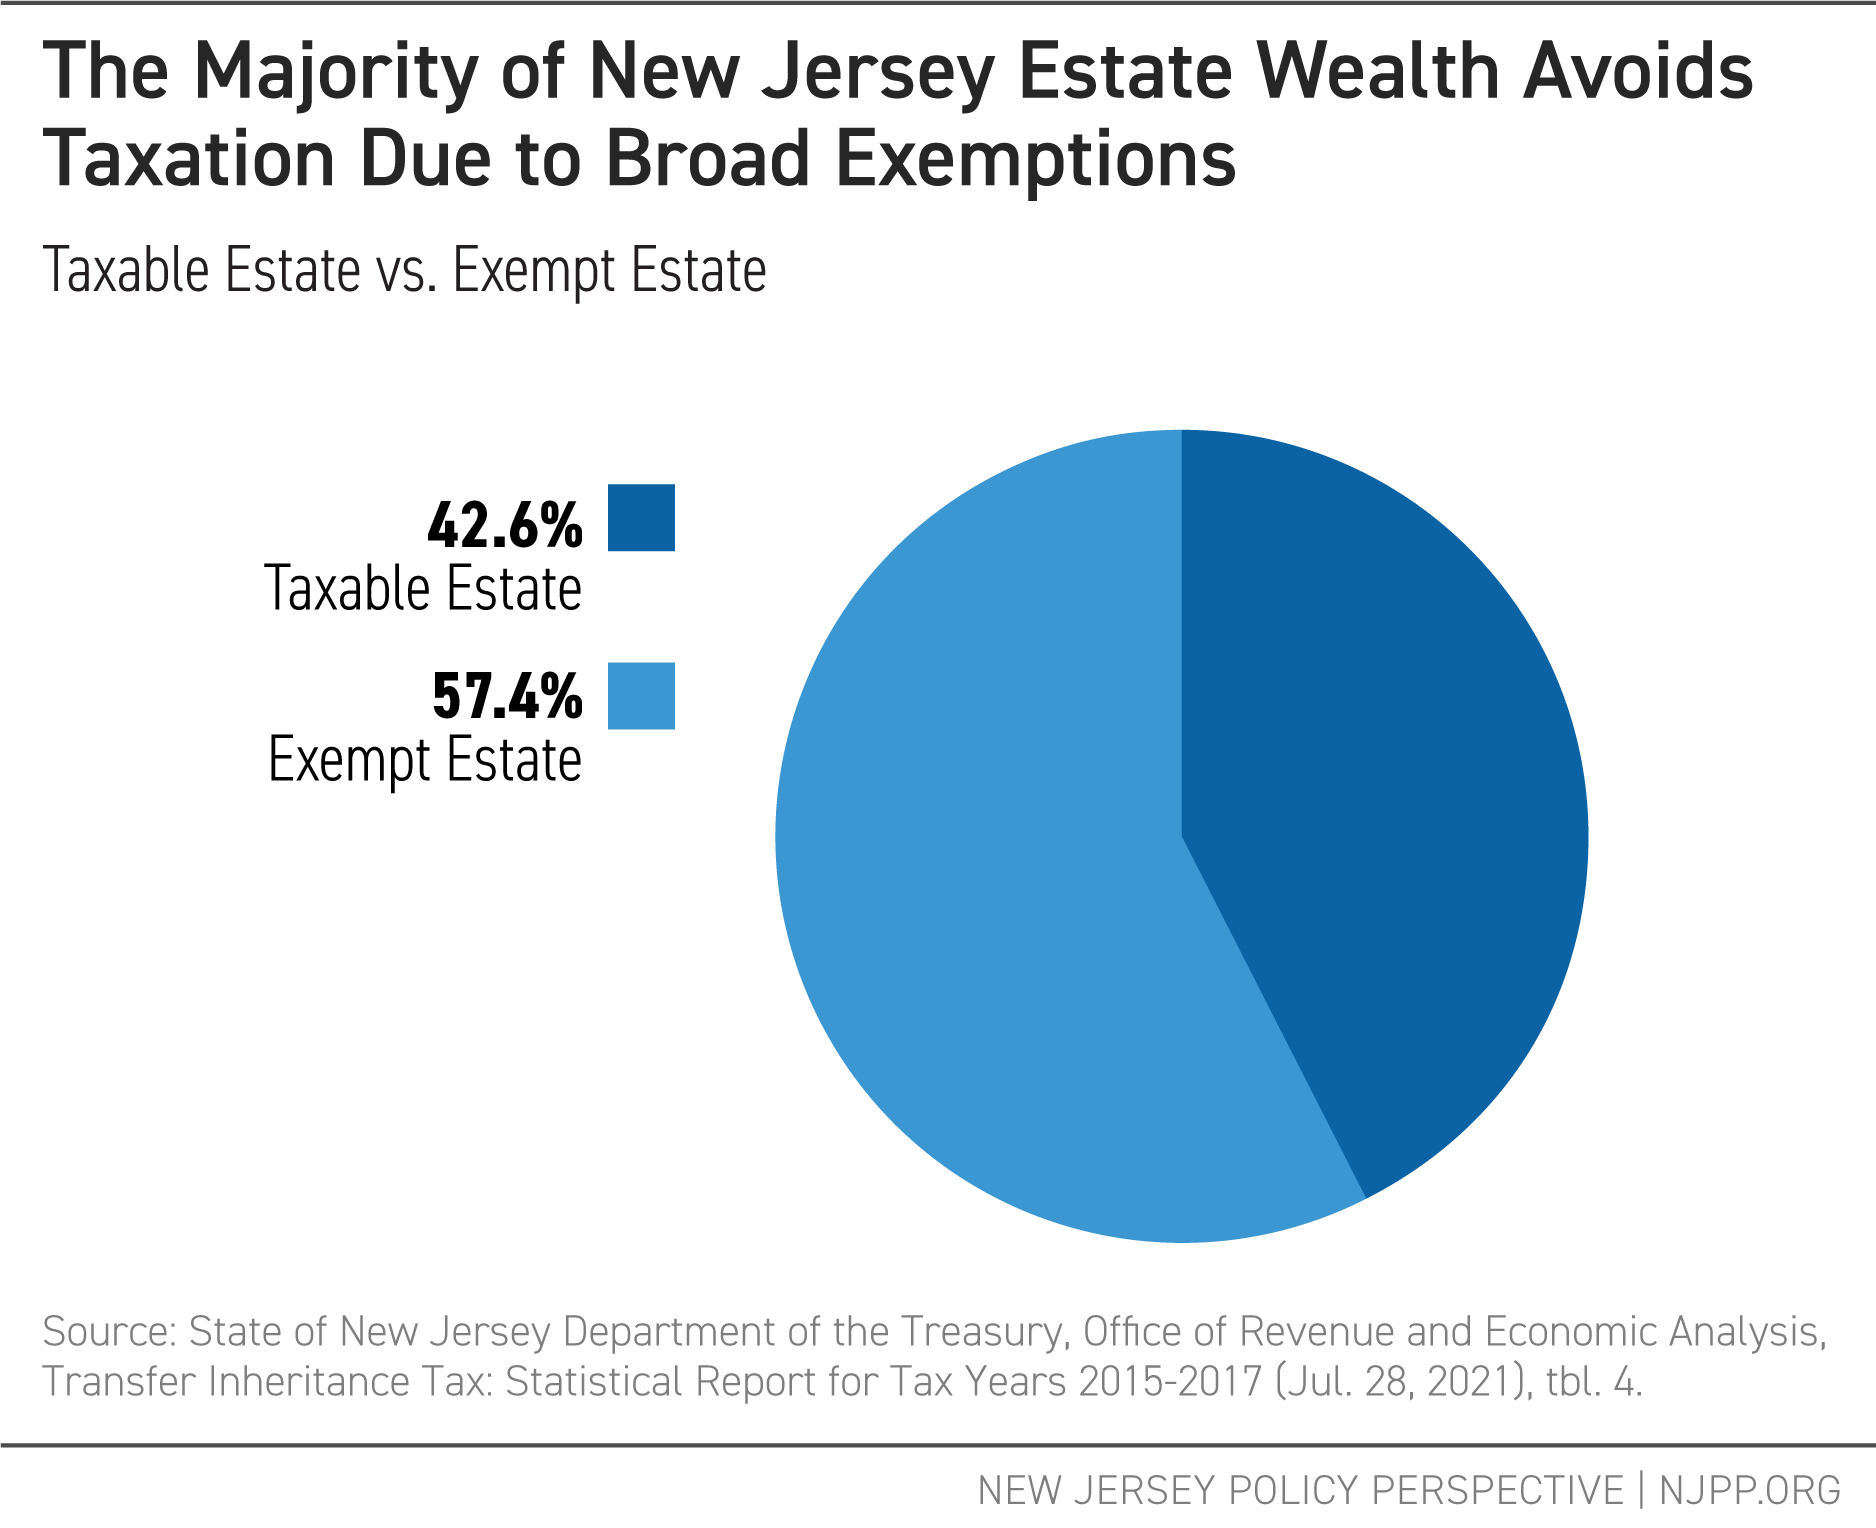
The Majority of New Jersey Estate Wealth Avoids Taxation Due to Broad Exemptions

Compounding matters, New Jersey eliminated its estate tax for residents passing away after December 31, 2017.[xxxvi] Estate taxes were levied on the total value of the estate of the deceased person, and the elimination of this tax has led to substantial revenue loss for the state, estimated at $560 million in 2022 — $598 million in 2024 dollars.[xxxvii]

Concerns about the potential risks of inherited wealth taxes at the state level, such as forced home sales to cover tax costs or an exodus of older high-wealth residents, do not have a strong basis in the available evidence. Real estate such as homes and land do not make up the bulk of estates, which are overwhelmingly composed of intangible property such as retirement and bank accounts.[xxxviii] Meanwhile, research on aging adults and their moving behavior shows, at most, little effect on residence decisions.[xxxix]

New Jersey has two options for taxing inherited wealth transfers:

  • Eliminating the inheritance tax exemptions and subjecting all transfers to taxation;
  • Restoring the estate tax.


Removing inheritance tax exemptions would generate an estimated $451 million in annual revenue for the state[xl]. Restoring the estate tax could generate between $450 million and $598 million annually. These amounts could vary, depending on state policy decisions such as the size of exemptions, whether some heirs would still have partial exemptions, and the interplay between the two taxes. Nonetheless, taxing intergenerational wealth transfers is an effective way to raise revenue while reducing wealth inequality.

Restore the Sales Tax Rate and Eliminate Loopholes and Exemptions

Proposal Overview

Reversing the damaging Christie-era sales tax cut while modernizing the sales tax by eliminating gimmicks and exemptions would create a broader tax base and generate much-needed revenue. Specifically, the proposal aims to: restore the sales tax from 6.625 percent to 7 percent; eliminate loopholes for car rental companies and yacht purchases; and tax high-end professional services. Taken together, this proposal could generate about $859 million.

Restoring the sales tax to 7 percent would generate $702 million annually, while eliminating the car rental and yacht loopholes would add another $157 million. Estimates for eliminating high-end professional services vary due to the complexity of industry-specific sales data.

Proposal Details

Increasing sales taxes can bring in much-needed reliable revenue for a budget facing a structural deficit.[xli] New Jersey’s sales tax supports the state’s general fund by taxing consumer purchases, with exemptions for groceries, medicine, and various services.[xlii] Although the sales tax does place proportionally more financial burden on lower-income residents, the below graph shows that people in the bottom 60 percent of incomes would see increases of under $100 if the sales tax cut were reversed, with even smaller amounts for lower-income residents.

To counter the impact on low- and moderate-income households, New Jersey can maintain and improve its overall progressive tax code by expanding refundable working family tax credits as detailed in the income tax section above.[xliii]
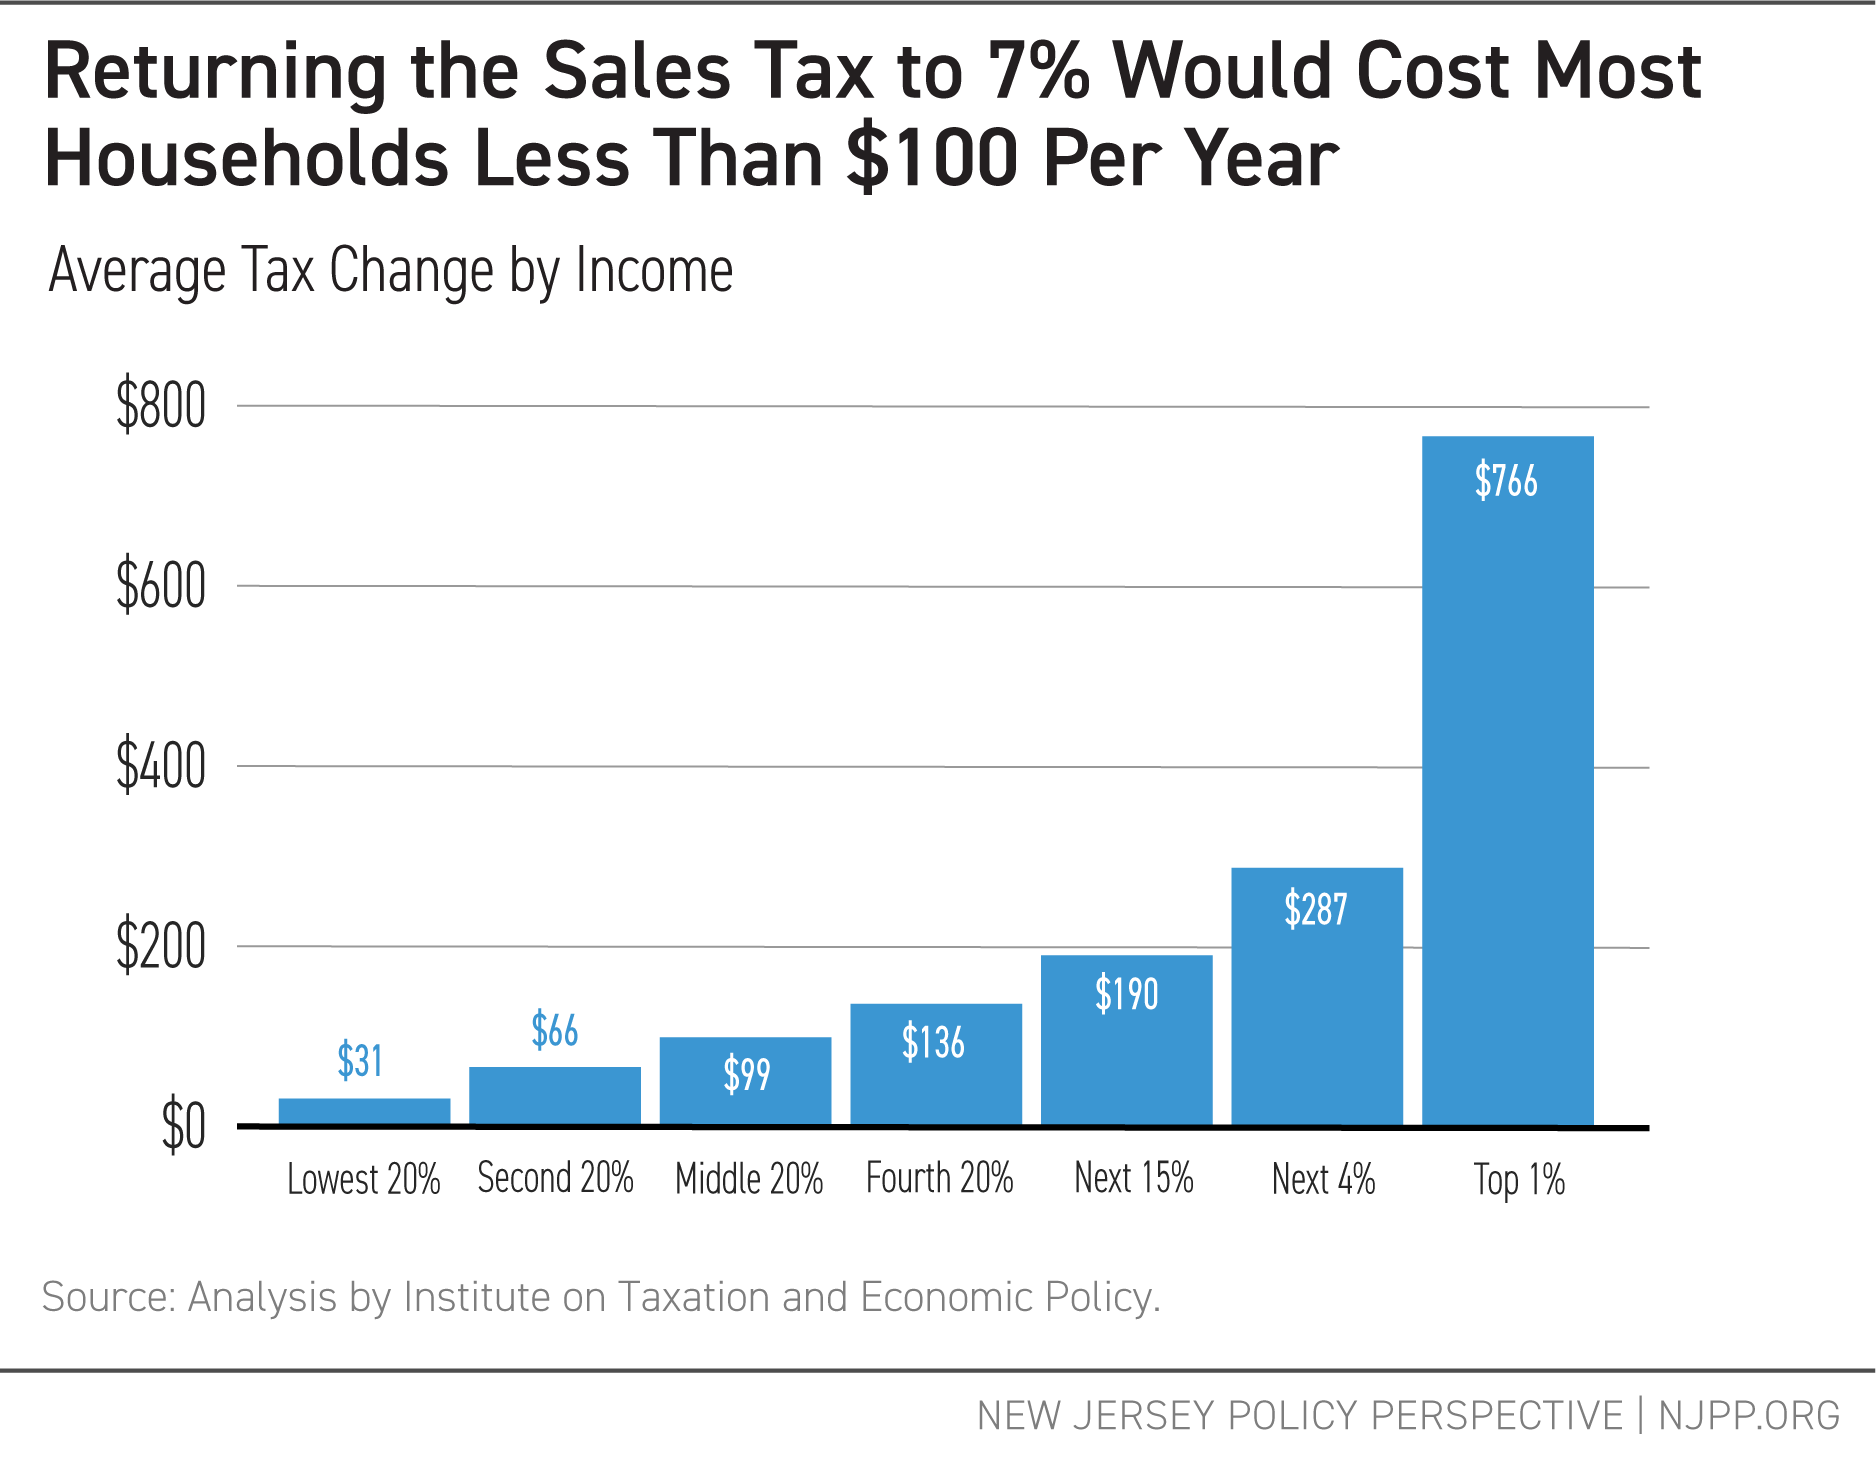
Returning the Sales Tax to 7% Would Cost Most Households Less Than $100 Per Year

Robust sales tax collections are essential for aligning the state’s revenues with state economic activity. However, it is crucial not to compound the sales tax’s regressive nature by allocating the revenue generated on regressive tax programs such as property tax credits.[xliv] Past ill-planned tax cuts, like the Christie-era sales tax reduction, cost the state hundreds of millions in much-needed tax dollars while providing little in terms of economic benefits.[xlv]

Restoring the sales tax to 7 percent would generate roughly $700 million in additional revenue for the state. About one-quarter of the revenue generated — around $180 million — would come from non-residents, such as tourists and shoppers from neighboring states.[xlvi]

Additionally, New Jersey’s sales tax is primarily geared toward goods, even though services now make up a larger portion of the economy as a whole. Services account for nearly two-thirds of all consumer spending in the state,[xlvii] yet high-end services remained exempt. Put differently, when a family goes to buy a computer, they pay taxes on that purchase, but if a large corporation buys computing services from a third-party vendor, they do not pay taxes on that service.

Examples of services exempt from sales tax include:

  • Accounting and Bookkeeping
  • Architects
  • Land Surveying
  • Attorneys
  • Engineers
  • Advertising and Marketing
  • Public Relations and Management Consulting
  • Lobbying and Consulting
  • Data Processing Services


These high-end services, categorized under “Professional, Scientific, and Technical Services” in the North American Industry Classification System, generated $67.6 billion in revenue in New Jersey, based on 2017 data,[xlviii] much of which was not subject to sales tax.[xlix]
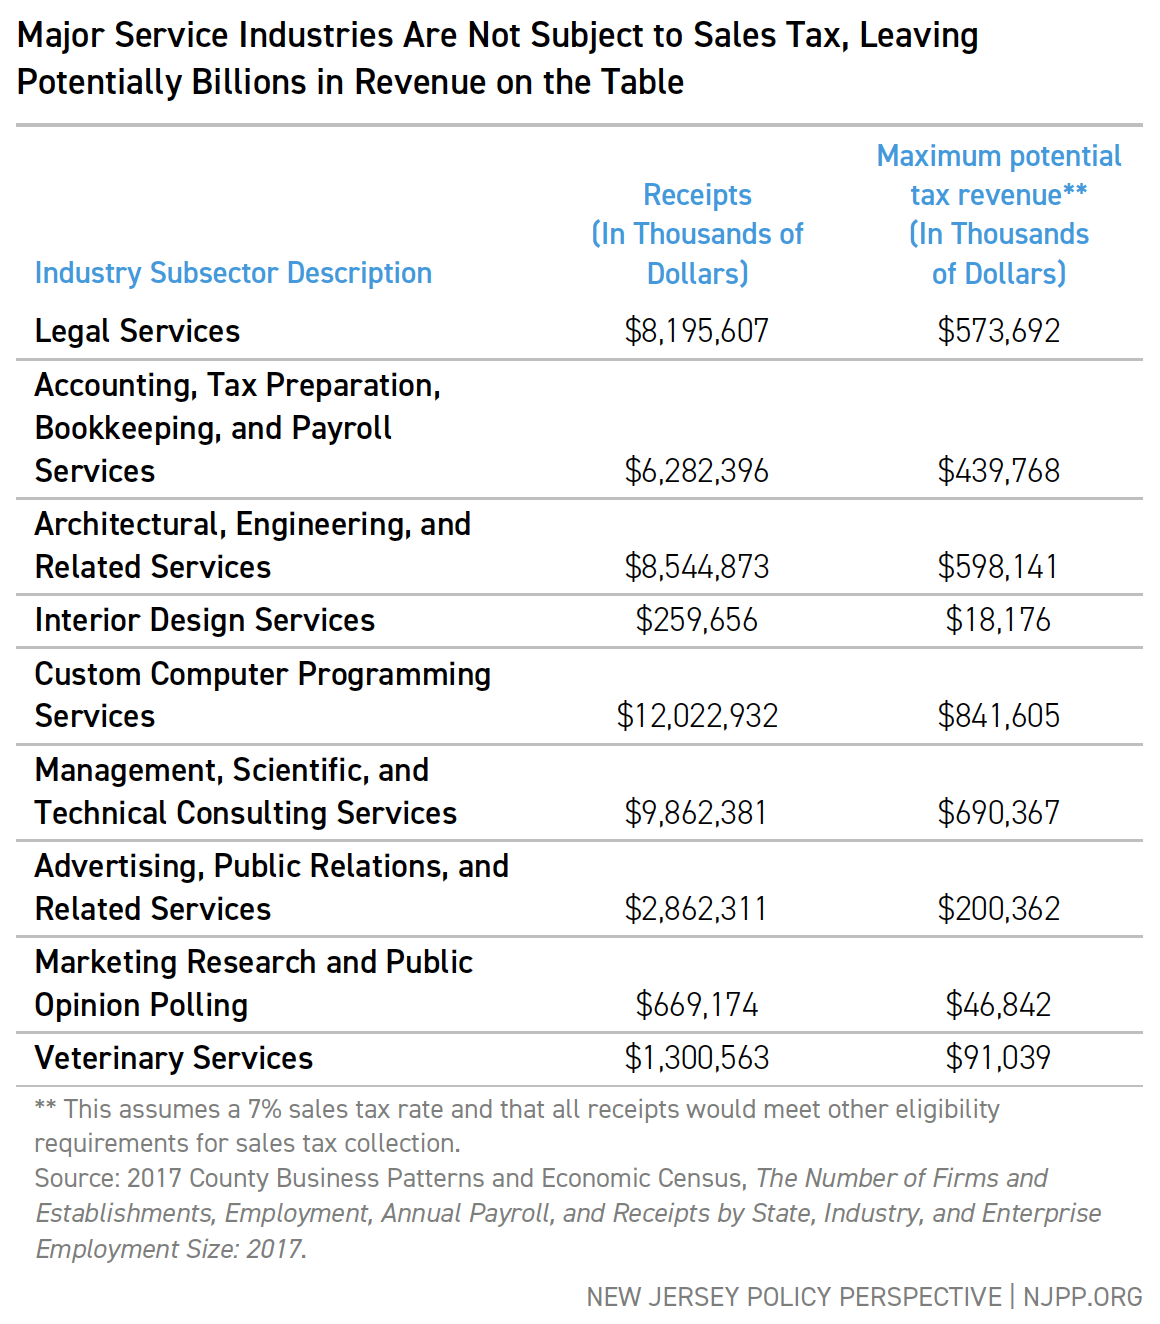
Major Service Industries Are Not Subject to Sales Tax, Leaving Potentially Billions in Revenue on the Table

Updating the state’s sales tax code to include these services and closing loopholes can bring in substantial revenue. Closing the car rental loophole alone could generate $174 million annually,[l] while repealing the yacht purchase tax would bring in about $15 million in additional annual revenue.[li]

The state has precedent for updating services subject to sales tax, but it has been nearly 20 years since the last major revision in 2006.[lii] That update expanded the tax to include services like pre-written computer software, flooring installation, storage units, and personal care services such as tanning salons and massage therapy.

Raise Fees on Super-Luxury Homes Sales

Proposal Overview

 New Jersey’s market for super-luxury homes continues to grow, as homes with high price tags continue to sell faster than more moderately priced homes.[liii] Currently, New Jersey levies a 1 percent tax on home sales greater than $1 million.[liv] This proposal suggests increasing the tax to 3 percent for homes over $1 million and 5 percent for homes over $2 million. This proposal would generate about $410 million in new annual revenues while affecting only the top 10 percent of home sales.

Proposal Details

The existing fee has done little to dampen the luxury home market, with sales of very expensive homes continuing to grow while the overall housing market has cooled. While many residents struggle with the high cost of housing in New Jersey, very expensive homes continue to change hands at a high rate. However, as detailed in a recent NJPP analysis, an added fee on expensive home sales would provide substantial revenue for the state.[lv] Home sales over $1 million represent less than 10 percent of home sales in the state, with home sales over $2 million making up less than 2 percent.[lvi] These transactions affect high-income or high-wealth households, leaving the vast majority of homeowners unaffected.

Home Sales Over $1 Million Make Up a Small Percentage of Total Home Sales

Require Worldwide Combined Corporate Reporting to Fight Against Profit Offshoring

Proposal Overview

As large multinational corporations have enjoyed the lion’s share of economic growth, they have also grown sophisticated in hiding their profits, shifting to tax haven countries to avoid tax exposure in the United States. As corporations have used sophisticated tax avoidance strategies to move their profits overseas, they have hidden their true profit margins from state regulators.[lvii] Across the country, the overall corporate tax base has shrunk even as corporate profits have skyrocketed to record levels.[lviii] New Jersey can help fight back against this corporate tax offshoring through a straightforward solution: require all corporations to report profits from global subsidiaries, not just those based in the United States. This approach, called “mandatory worldwide combined reporting,” is a critical tool to address profit offshoring, which has accelerated in recent years, significantly reducing the corporate tax base.

Currently, New Jersey taxes corporations that meet a certain threshold of sales in New Jersey by applying a tax to their overall profits, based on the proportion of those sales occurring in the state.[lix] By expanding this to include all global profits, New Jersey would increase its overall tax base, raising an estimated $888 million in annual revenue simply by requiring corporations to disclose all profits, including those declared overseas.

Proposal Details

The concept of requiring full disclosure, called “mandatory worldwide combined reporting,” simplifies the complex web of corporate offshore holdings by requiring that all profits generated by companies controlled by a parent company be included in New Jersey’s corporate tax calculations.[lx] Currently, under “water’s edge reporting,” New Jersey only requires that corporations disclose profits generated by companies in the United States, taxing them based on the portion of sales made within the state.[lxi] But, by shifting profits overseas, many corporations make their biggest profits invisible to the state’s taxing authority.

Mandatory combined reporting would close this loophole and level the playing field, by forcing large multinational corporations to show where their profits are hidden. This would also benefit smaller domestic corporations that lack the resources to establish foreign subsidiaries or operate in foreign tax haven countries.

An estimate from 2019 placed the potential benefit to New Jersey of adopting worldwide combined reporting at $714 million.[lxii] This figure is now projected to be nearly $890 million adjusted for inflation.

Increase State Tax Enforcement Workforce

Proposal Overview

The New Jersey state’s tax division hires auditors and collectors to examine the returns of taxpayers to identify errors and collect assessments. This workforce helps ensure the state maximizes its collections and reduces fraud and errors, particularly among high-income and high-wealth taxpayers. However, the number of auditors has declined since the Great Recession. New Jersey should restore its auditor workforce to pre-Great Recession levels, increasing the number of auditors from 340 to at least 485.[lxiii] This proposal would generate about $385 million annually.

Proposal Details

Over the past 20 years, New Jersey’s auditor workforce has shrunk by 30 percent, even though the complexity of the state’s budget and tax code have grown substantially. This reduction has weakened the state’s ability to combat tax fraud and ensure accuracy, especially for complex tax returns. On average, each New Jersey auditor identifies about $2.35 million in assessments.[lxiv] Restoring the workforce to 485 would yield $341 million in additional annual revenue.[lxv] Reinstating the 20 compliance officers lost since 2004 would add another $44 million, bringing the total potential revenue increase to $385 million.[lxvi] These figures are consistent with past performance when auditor staffing levels were higher, with assessment surpassing $1 billion during from 2007 to 2010 when auditor workforces were at their peak.[lxvii]
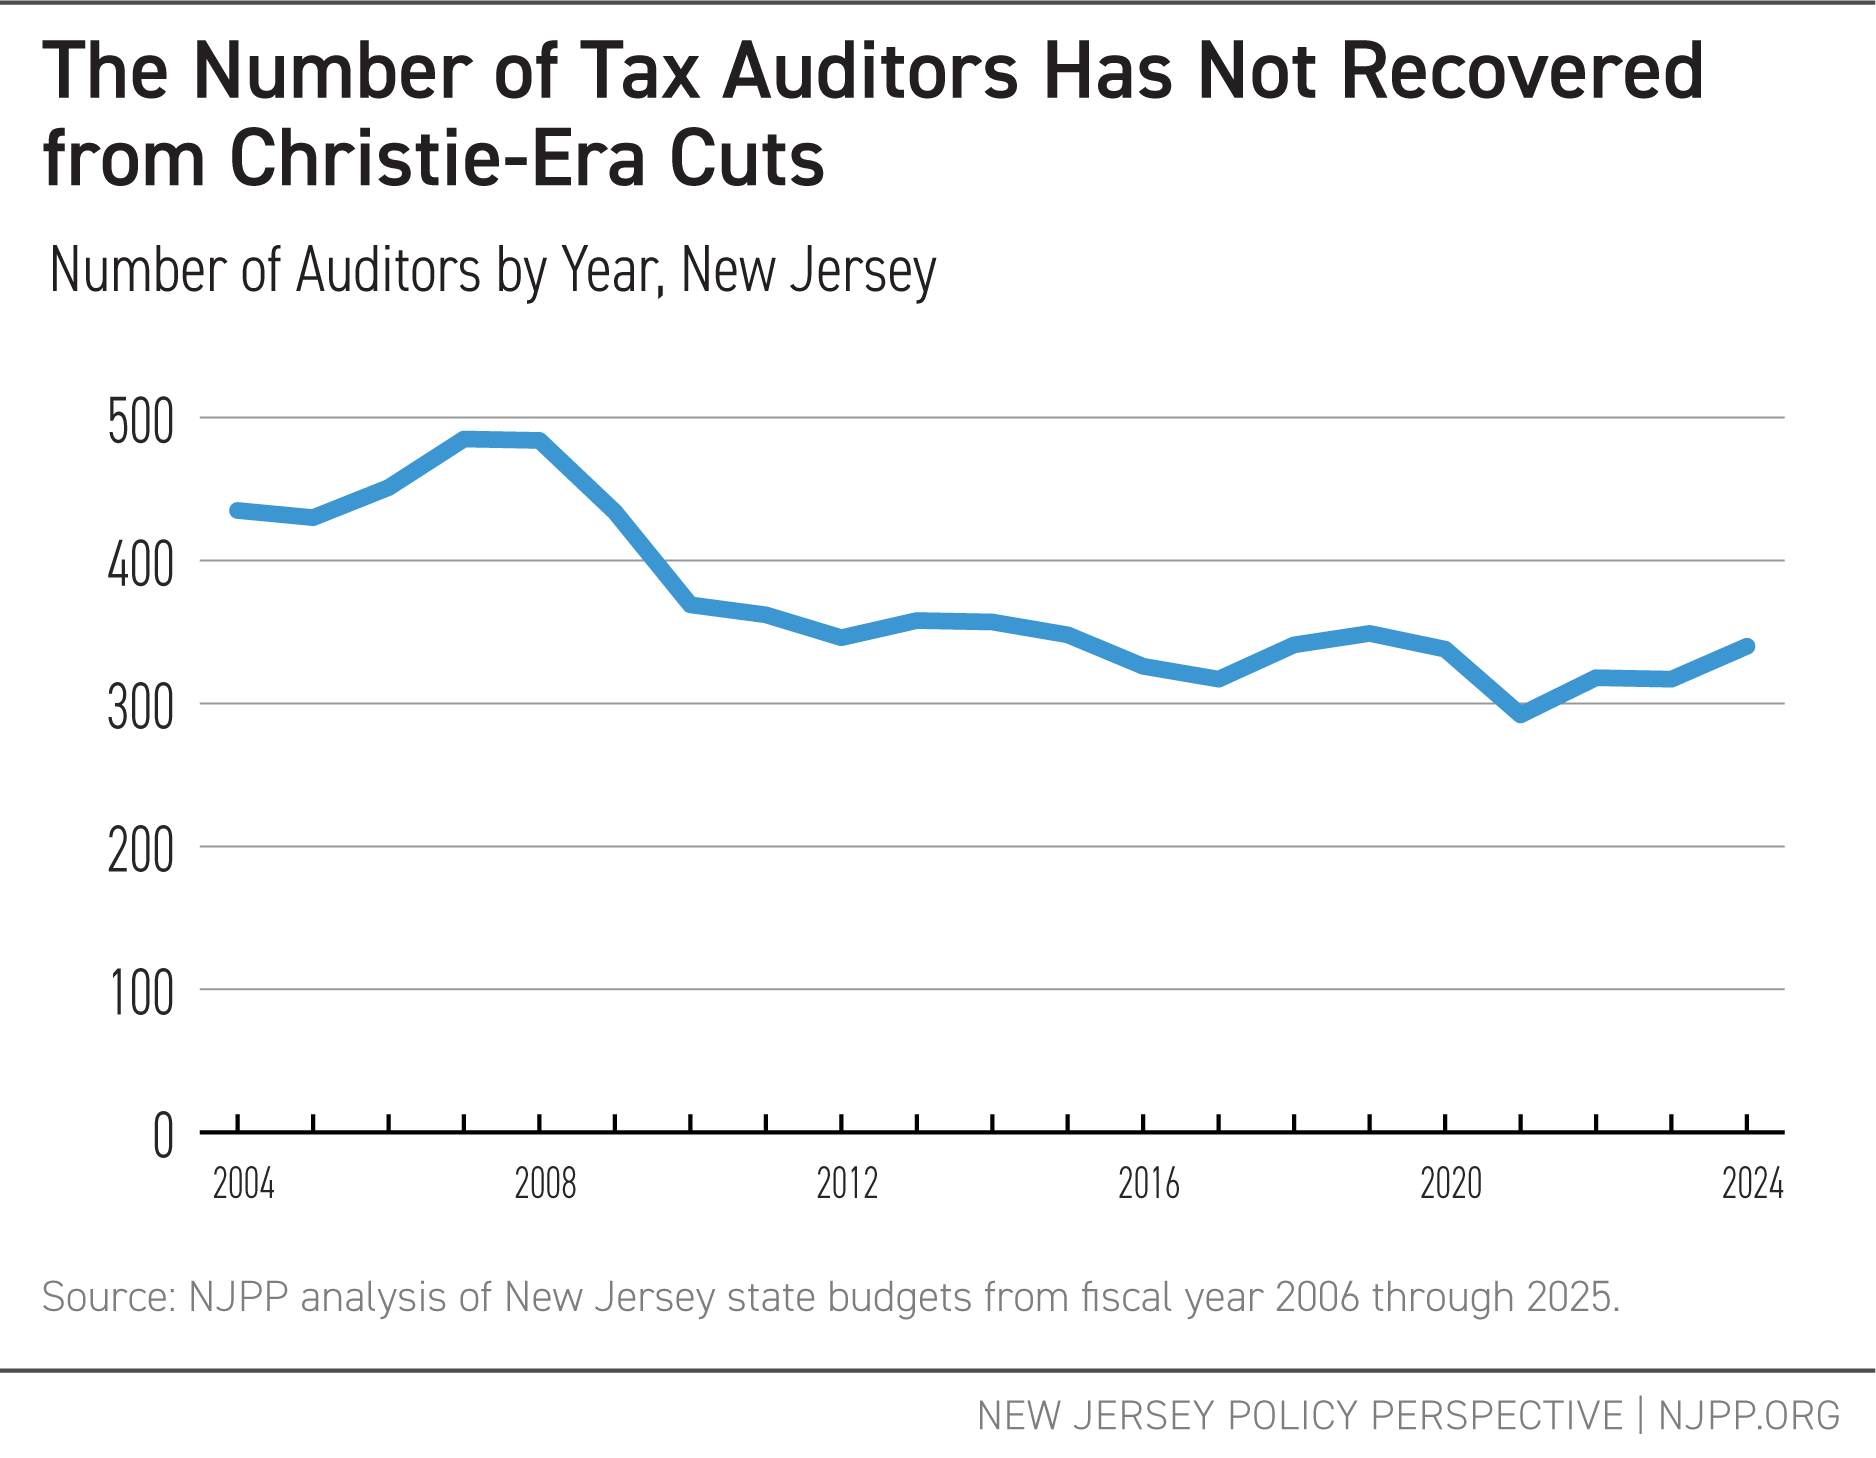
The Number of Tax Auditors Has Not Recovered from Christie-Era Cuts

Federal efforts to target high-income individuals and large corporations out of compliance with their tax obligations have yielded substantial collections, with nearly $1 billion in past-due taxes collected.[lxviii] Federal tax authorities have noted that the complexity of higher-income audits and auditor attrition has extended the amount of time needed to complete audits.[lxix]

What’s Next for New Jersey

New Jersey needs a set of new revenue streams that will fund the next generation of programs to improve affordability and induce economic growth for generations to come. Whether that comes in the form of increased investments in housing and infrastructure, substantial expansions of tax credits and cash assistance for working families, or increased support for K-12 and higher education, any expansions in public programs to assist affordability will need funding. However, to fully advance equity and lift up the state’s working-class and middle-class residents, these revenues must be generated progressively, ensuring that the state’s wealthiest residents pay their fair share for prosperity for all.

Broadly, this package of potential revenue raisers would set New Jersey on a path toward fiscal responsibility, generate sufficient funds to invest in growth and affordability, and reduce income and economic inequity. Without bold changes in tax policy, New Jersey runs the risk of falling back into the rut it was in at the end of the Christie administration, with a low credit rating, enormous pension and school funding liabilities, and a budget that slashed state employment and investment.[lxx] The choice is clear: New Jersey can choose prosperity for all through targeted taxation of the very wealthy, or a return to fiscal brinkmanship and the continued deferral of essential investments in the state’s well-being.

Net Effect of Tax Policy Changes Would Result in Nearly $4 Billion in New Revenue Annually


End Notes

[i] New Jersey ranks second in the nation in median income at $99,781. See Katherine Engel and Kirby G. Posey, U.S. Census Bureau, Household Income in States and Metropolitan Areas: 2023, p. 3, tbl. 1 (Sept. 2024), https://www2.census.gov/library/publications/2024/demo/acsbr-023.pdf. New Jersey ranks in the top ten in median net worth. See U.S. Census Bureau,

Wealth and Asset Ownership for Households, by Type of Asset and States: 2022, table 1,

Survey of Income and Program Participation, Survey Year 2023, https://www2.census.gov/programs-surveys/demo/tables/wealth/2022/wealth-asset-ownership/state_wealth_tables_dy2022.xlsx. New Jersey’s gross domestic product ranks tenth nationally. U.S. Bureau of Economic Analysis, SQGDP1 State quarterly gross domestic product (GDP) summary (accessed Wednesday, October 16, 2024), https://apps.bea.gov/itable/index.html?appid=70&stepnum=40&Major_Area=3&State=0&Area=XX&TableId=532&Statistic=3&Year=2024:Q2&YearBegin=-1&Year_End=-1&Unit_Of_Measure=Levels&Rank=1&Drill=1&nRange=5.

[ii] U.S. Census Bureau, U.S. Department of Commerce. “Poverty Status in the Past 12 Months.” American Community Survey, ACS 1-Year Estimates Subject Tables, Table S1701, 2023, https://data.census.gov/table/ACSST1Y2023.S1701?q=child poverty&g=040XX00US34. Accessed on October 16, 2024.

[iii] Estelle Sommeiller & Mark Price, Economic Policy Institute, The New Gilded Age: Income Inequality in the U.S. by State, Metropolitan Area, and County at tbl. 1 (July 19, 2018), https://files.epi.org/pdf/147963.pdf.

[iv] U.S. Bureau of Economic Analysis, Corporate Profits with Inventory Valuation Adjustment (IVA) and Capital Consumption Adjustment (CCAdj) [CPROFIT], retrieved from FRED, Federal Reserve Bank of St. Louis; https://fred.stlouisfed.org/series/CPROFIT, October 16, 2024. U.S. Bureau of Economic Analysis, Compensation of Employees: Wages and Salary Accruals [WASCUR], retrieved from FRED, Federal Reserve Bank of St. Louis; https://fred.stlouisfed.org/series/WASCUR, . https://fred.stlouisfed.org/graph/?g=G8JT.

[v] New Jersey Institute for Social Justice, The Two New Jerseys by the Numbers: Racial Wealth Disparities in the Garden State (March 2023), https://njisj.org/wp-content/uploads/2023/07/Two_New_Jerseys_By_the_Numbers_Data_Brief_3.23.23-compressed.pdf.

[vi] By contrast a regressive tax system has higher tax rates for lower-income residents. For more information on progressive and regressive tax systems, see Institute on Taxation and Economic Policy, Who Pays? A Distributional Analysis of the Tax Systems in All 50 States, Seventh Edition (Jan. 2024), https://sfo2.digitaloceanspaces.com/itep/ITEP-Who-Pays-7th-edition.pdf.

[vii] Alex Ambrose & Peter Chen, New Jersey Policy Perspective, Getting Back on Track: Fully Fund NJ Transit by Taxing Big Corporations, Sept. 27, 2023, https://www.njpp.org/publications/report/getting-back-on-track-fully-fund-nj-transit-by-taxing-big-corporations/.

[viii] For a review on the accumulation of insufficient funding of the school funding formula, see Bruce Baker & Mark Weber, New Jersey Policy Perspective, School Funding in New Jersey: A Fair Future for All, Part 3: The School Funding Reform Act – 2020 Update (Nov. 2020), https://www.njpp.org/wp-content/uploads/2020/11/NJPP-School-Funding-in-New-Jersey-A-Fair-Future-for-All-Part-3.pdf.

[ix] Gordon MacInnes & Sheila Reynertson, New Jersey Policy Perspective, The Notorious Nine: How Key Decisions Sent New Jersey’s Financial Health Spiraling Down Over Two Decades (Sept. 2016), https://www.njpp.org/wp-content/uploads/2016/09/NJPPNotorious9Sept2016.pdf.

[x] Multi-Year Budget Workgroup, Steve Sweeney Center for Public Policy, New Jersey’s Fiscal Cliff: Current Services Budget Projections, Long-Term Economic Forecast, and the Multi-Year Structural Deficit (June 13, 2024), https://chss.rowan.edu/centers/sweeney_center/mybwreportjune2024web.pdf.

[xi] Multi-Year Budget Workgroup, Steve Sweeney Center for Public Policy, New Jersey’s Fiscal Cliff: Current Services Budget Projections, Long-Term Economic Forecast, and the Multi-Year Structural Deficit (June 13, 2024), https://chss.rowan.edu/centers/sweeney_center/mybwreportjune2024web.pdf.

[xii] Steve Wamhoff, Institute on Taxation and Economic Policy, Extending Temporary Provisions of the 2017 Trump Tax Law: Updated National and State-by-State Estimates, Sept. 13, 2024, https://itep.org/trump-tax-law-tcja-permanent-state-by-state-estimates/.

[xiii] Nikita Biryukov, NJ Transit approves $3B budget amid outcry over fare hikes, New Jersey Monitor, Jul. 25, 2024, https://newjerseymonitor.com/2024/07/25/nj-transit-approves-3b-budget-amid-outcry-over-fare-hikes/.

[xiv] Based on analysis by the Institute on Taxation and Economic Policy.

[xv] John Reitmeyer, Explainer: A Look Under the Hood of NJ’s Income Tax and Its Special Quirks, NJ Spotlight News, Apr. 9, 2019, https://www.njspotlightnews.org/2019/04/19-04-08-explainer-a-look-under-the-hood-of-njs-income-tax-and-its-special-quirks/.

[xvi] Data shows that the top 5 percent of households by income in New Jersey take home more than 22 percent of the state’s aggregate income. The top 20 percent take home more than 51 percent. B19082 Census 1-year 2023 estimate.

[xvii] Based on analysis by the Institute on Taxation and Economic Policy.

[xviii] U.S. Census Bureau, State Government Tax Collections, Individual Income Taxes in New Jersey [NJINCTAX], retrieved from FRED, Federal Reserve Bank of St. Louis; https://fred.stlouisfed.org/series/NJINCTAX, October 16, 2024.

[xix] Wesley Tharpe, Center on Budget and Policy Priorities, Raising State Income Tax Rates at the Top a Sensible Way to Fund Key Investments (Feb. 7, 2019), https://www.cbpp.org/research/state-budget-and-tax/raising-state-income-tax-rates-at-the-top-a-sensible-way-to-fund-key.

[xx] The number of tax filers with $1 million or more in income increased from 22,720 to 33,770 between 2019 and 2021. Compare Internal Revenue Service, Statistics of Income, Table 2: Individual Income and Tax Data, by State and Size of Adjusted Gross Income, Tax Year 2019 (Dec. 2021), https://www.irs.gov/pub/irs-soi/19in31nj.xlsx with Internal Revenue Service, Statistics of Income, Table 2: Individual Income and Tax Data, by State and Size of Adjusted Gross Income, Tax Year 2021 (Feb. 2024), https://www.irs.gov/pub/irs-soi/21in31nj.xlsx.

[xxi] Samantha Waxman et al., Center on Budget and Policy Priorities, Interactive Map: States Should Continue Enacting and Expanding Child Tax Credits and Earned Income Tax Credits (Aug. 24, 2024), https://www.cbpp.org/research/state-budget-and-tax/states-should-continue-enacting-and-expanding-child-tax-credits-and.

[xxii] New Jersey Division of Taxation, NJ Earned Income Tax Credit Frequently Asked Questions (last updated Dec. 2023), https://www.nj.gov/treasury/taxation/eitc/eitcfaq.shtml

[xxiii] New Jersey Division of Taxation, Child Tax Credit (last updated Jan. 5, 2024), https://www.nj.gov/treasury/taxation/individuals/childtaxcredit.shtml.

[xxiv] Elise Gould, Child Tax Credit expansions were instrumental in reducing poverty rates to historic lows in 2021, Economic Policy Institute Working Economics Blog, Sept. 22, 2022, https://www.epi.org/blog/child-tax-credit-expansions-were-instrumental-in-reducing-poverty-to-historic-lows-in-2021/.

[xxv] Vineeta Kapahi, New Jersey Policy Perspective, Building a More Immigrant Inclusive Tax Code: Expanding the EITC to ITIN Filers (July 2020),

https://www.njpp.org/wp-content/uploads/2020/07/NJPP-Report-Building-a-More-Immigrant-Inclusive-Tax-Code-Expanding-the-EITC-to-ITIN-Filers-1.pdf. For more on the nearly $100 billion in tax payments by undocumented immigrants including more than $1.3 billion in New Jersey alone, see Carl Davis, Marco Guzman & Emma Sifre, Institute on Taxation and Economic Policy, Tax Payments by Undocumented Immigrants, Jul. 30, 2024, https://sfo2.digitaloceanspaces.com/itep/ITEP-Tax-Payments-by-Undocumented-Immigrants-2024.pdf.

[xxvi] N.J. Stat. Sec. 54A:4-17.1

[xxvii] Mark Lino et al., U.S. Department of Agriculture, Center for Nutrition Policy and Promotion, Expenditures on Children by Families, 2015,. Miscellaneous Publication No. 1528-2015 (Mar. 2017), p. 15, https://fns-prod.azureedge.us/sites/default/files/resource-files/crc2015-march2017.pdf.

[xxviii] For additional information on proposals to expand the state’s Child Tax Credit, see Peter Chen, New Jersey Policy Perspective, How an Expanded Child Tax Credit Would Help More Hard-Working New Jersey Families, Jan. 31, 2023, https://www.njpp.org/publications/report/how-an-expanded-child-tax-credit-would-help-more-hard-working-new-jersey-families/. Analysis of an expanded child tax credit has shown that New Jersey could reduce child poverty by 25 percent with a $2,000 credit for children under age 6 and $1,700 for ages 6-18. See Institute on Taxation and Economic Policy, Columbia Center on Poverty and Social Policy, Child Tax Credit Options for Reducing Child Poverty (2022),  https://itep.sfo2.digitaloceanspaces.com/Child-Tax-Credit-Options-New-Jersey-2022.pdf.

[xxix] New Jersey Division of Taxation, General Information: Inheritance and Estate Tax, O-10-C (Jan. 2017), https://www.nj.gov/treasury/taxation/pdf/other_forms/inheritance/o10c.pdf.

[xxx] See Samantha Waxman, Center on Budget and Policy Priorities, State Taxes on Inherited Wealth, Jun. 2021, https://www.cbpp.org/research/state-budget-and-tax/issue-brief-state-taxes-on-inherited-wealth; Martin Poethke & Patrick Brennan, New Jersey Office of Legislative Services, Legislative Fiscal Estimate [Second Reprint], Assembly, No. 12, Oct. 12, 2016, https://www.njleg.state.nj.us/bill-search/2016/A12/bill-text?f=A0500&n=12_E3.

[xxxi] N.J. Stat. Sec. 54:34-2

[xxxii] Andrew Van Dam, How inheritance data secretly explains U.S. inequality, Washington Post, Nov. 10, 2023, https://www.washingtonpost.com/business/2023/11/10/inheritance-america-taxes-equality/.

[xxxiii] State of New Jersey Department of the Treasury, Office of Revenue and Economic Analysis, Transfer Inheritance Tax: Statistical Report for Tax Years 2015-2017 (Jul. 28, 2021), https://www.nj.gov/treasury/economics/documents/pdf/stats/Transfer-Inheritance-Tax-Statistical-Report-TY-2015-2017.pdf at 5.

[xxxiv] Andrew Van Dam, How inheritance data secretly explains U.S. inequality, Washington Post, Nov. 10, 2023, https://www.washingtonpost.com/business/2023/11/10/inheritance-america-taxes-equality/.

[xxxv] Bhutta, Neil, Andrew C. Chang, Lisa J. Dettling, and Joanne W. Hsu (2020). “Disparities in Wealth by Race and Ethnicity in the 2019 Survey of Consumer Finances,” FEDS Notes. Washington: Board of Governors of the Federal Reserve System, September 28, 2020, https://doi.org/10.17016/2380-7172.2797.

[xxxvi] N.J. Stat. Sec. 54:38-1.a.(4). Previously the minimum size of an estate to be eligible for the tax was $675,000. As with other estate taxes including the federal estate tax, wealthy residents could still avoid the tax through a variety of methods. See U.S. Senate Committee on Finance, Estate Tax Schemes: How America’s Most Fortunate Hide Their Wealth, Flout Tax Laws, and Grow the Wealth Gap, Oct. 12, 2017, https://www.finance.senate.gov/imo/media/doc/101217%20Estate%20Tax%20Whitepaper%20FINAL1.pdf.

[xxxvii] Martin Poethke & Patrick Brennan, New Jersey Office of Legislative Services, Legislative Fiscal Estimate [Second Reprint], Assembly, No. 12, Oct. 12, 2016, https://www.njleg.state.nj.us/bill-search/2016/A12/bill-text?f=A0500&n=12_E3.

[xxxviii] Personal property made up 70 percent of estates, compared to real property at 18 percent in tax year 2017, the most recent year of available data State of New Jersey Department of the Treasury, Office of Revenue and Economic Analysis, Transfer Inheritance Tax: Statistical Report for Tax Years 2015-2017 (Jul. 28, 2021), https://www.nj.gov/treasury/economics/documents/pdf/stats/Transfer-Inheritance-Tax-Statistical-Report-TY-2015-2017.pdf at 6.

[xxxix]Samantha Waxman, Center on Budget and Policy Priorities, State Taxes on Inherited Wealth, Jun. 2021, https://www.cbpp.org/research/state-budget-and-tax/issue-brief-state-taxes-on-inherited-wealth, n.1.

[xl] Given that inheritance tax data is limited, this estimate is based on key assumptions. First, the estimate assumes that the effective tax rate on Class A (lineal descendants and spouses) and Class C (siblings) beneficiaries would be the same as the current effective tax rate on Class D beneficiaries if the current Class D marginal rate structure were applied to Class A and Class C beneficiaries. Second, it assumes that the exempt estate is evenly distributed over the currently exempt beneficiaries, even though lineal descendants and spouses likely inherit larger inheritances than unrelated persons and more distant relations. Third, the estimate assumes that the ratio of share of returns between Class C and Class D beneficiaries correlates with the size of the tax base for each category.

[xli] Sheila Reynertson, New Jersey Policy Perspective, Modernizing New Jersey’s Sales Tax Will Level

the Playing Field & Help the Economy Thrive, Feb. 2018,

https://www.njpp.org/wp-content/uploads/2018/02/NJPPSalesTaxReformsFeb2018.pdf.

[xlii] For a comprehensive look at New Jersey’s sales and use tax exemptions, see New Jersey Division of Taxation, New Jersey Sales Tax Guide, Tax Topic Bulletin S&U-4, July 2022, https://www.nj.gov/treasury/taxation/pdf/pubs/sales/su4.pdf.

[xliii] To see how New Jersey’s sales tax regressivity is counteracted by its progressive income tax, see Institute on Taxation and Economic Policy, Who Pays? New Jersey State and Local Tax Shares of Family Income (Jan. 2024), https://sfo2.digitaloceanspaces.com/itep/itep-whopays7-New-Jersey.pdf.

[xliv] Testimony of Peter Chen, Senior Policy Analyst, New Jersey Policy Perspective, Before Stay NJ Task Force, March 13, 2024, https://www.njpp.org/wp-content/uploads/2024/05/NJPP-StayNJ-Committee-Testimony-03-13-24.pdf.

[xlv] Based on analysis of data from the Institute on Taxation and Economic Policy.

[xlvi] Based on analysis of data from the Institute on Taxation and Economic Policy.

[xlvii] U.S. Bureau of Economic Analysis, “SAPCE1 Personal consumption expenditures (PCE) by major type of product 1” (accessed Wednesday, October 16, 2024), https://apps.bea.gov/itable/?ReqID=70&step=1&_gl=1*1c592j9*_ga*NDUzNjQ0MzAyLjE3MjY1MTAxMDc.*_ga_J4698JNNFT*MTcyNjUxMDEwNy4xLjAuMTcyNjUxMDEwNy42MC4wLjA.#eyJhcHBpZCI6NzAsInN0ZXBzIjpbMSwyOSwyNSwzMSwyNiwyNywzMF0sImRhdGEiOltbIlRhYmxlSWQiLCI1MjQiXSxbIk1ham9yX0FyZWEiLCIwIl0sWyJTdGF0ZSIsWyIwIl1dLFsiQXJlYSIsWyIzNDAwMCJdXSxbIlN0YXRpc3RpYyIsWyIyIiwiMTMiXV0sWyJVbml0X29mX21lYXN1cmUiLCJMZXZlbHMiXSxbIlllYXIiLFsiLTEiXV0sWyJZZWFyQmVnaW4iLCItMSJdLFsiWWVhcl9FbmQiLCItMSJdXX0=.

[xlviii] U.S. Census Bureau, Survey of U.S. Businesses, The Number of Firms and Establishments, Employment, Annual Payroll, and Receipts by State, Industry, and Enterprise Employment Size: 2017 (2021), available at https://www.census.gov/data/tables/2017/econ/susb/2017-susb-annual.html.

[xlix] New Jersey Division of Taxation, New Jersey Sales Tax Guide, Tax Topic Bulletin S&U-4, July 2022, https://www.nj.gov/treasury/taxation/pdf/pubs/sales/su4.pdf, pp. 14-15.

[l] NetChoice, Big Rental’s Rules of the Road: Tax Loopholes and Sneaky Subsidies, Policy Note, April 2020, https://netchoice.org/wp-content/uploads/2020/04/Turo-VLF-v.3.pdf, p. 9. The $174 million estimate adjusts the annual estimate of $142 million in 2020 for 2024 dollars.

[li] Sheila Reynertson, New Jersey Policy Perspective, Modernizing New Jersey’s Sales Tax Will Level

the Playing Field & Help the Economy Thrive, Feb. 2018, https://www.njpp.org/wp-content/uploads/2018/02/NJPPSalesTaxReformsFeb2018.pdf.

[lii] Pub. L. 2006, c.44.

[liii] Allison Pries, The housing market in N.J. has slowed — except for these types of homes, NJ Advance Media for NJ.com, Mar. 10, 2024, https://www.nj.com/realestate-news/2024/03/the-housing-market-in-nj-has-slowed-except-for-these-types-of-homes.html.

[liv] NJ Stat. Sec, 46:15-7.2 (2023)

[lv] Peter Chen, New Jersey Policy Perspective, Taxing “Super Luxury” Home Sales Could Make New Jersey Affordable for More Residents, Sep. 10, 2024, https://www.njpp.org/publications/blog-category/taxing-super-luxury-home-sales-could-make-new-jersey-affordable-for-more-residents/.

[lvi] Peter Chen, New Jersey Policy Perspective, Taxing “Super Luxury” Home Sales Could Make New Jersey Affordable for More Residents, Sep. 10, 2024, https://www.njpp.org/publications/blog-category/taxing-super-luxury-home-sales-could-make-new-jersey-affordable-for-more-residents/.

[lvii] Michael Mazerov, Center on Budget and Policy Priorities, States Can Fight Corporate Tax Avoidance by Requiring Worldwide Combined Reporting, June 27, 2024, https://www.cbpp.org/research/state-budget-and-tax/states-can-fight-corporate-tax-avoidance-by-requiring-worldwide-0.

[lviii] Josh Bivens, Economic Policy Institute, Reclaiming Corporate Tax Revenues, April. 14, 2022, https://www.epi.org/publication/reclaiming-corporate-tax-revenues/ at figure G.

[lix] Michael Mazerov, Center on Budget and Policy Priorities, The “Single Sales Factor” Formula for State Corporate Taxes, Sept. 1, 2005, https://www.cbpp.org/sites/default/files/archive/3-27-01sfp.htm.

[lx] Michael Mazerov, Center on Budget and Policy Priorities, States Can Fight Corporate Tax Avoidance by Requiring Worldwide Combined Reporting, June 27, 2024, https://www.cbpp.org/research/state-budget-and-tax/states-can-fight-corporate-tax-avoidance-by-requiring-worldwide-0.

[lxi] N.J. Admin. Code § 18:7-21.15 (2024).

[lxii] Richard Phillips, Institute on Taxation and Economic Policy, A Simple Fix for a $17 Billion Loophole: How States Can Reclaim Revenue Lost to Tax Havens, Jan. 17, 2019, https://itep.org/a-simple-fix-for-a-17-billion-loophole/.

[lxiii] The state peaked at 485 auditors in fiscal year 2007.

[lxiv] In Fiscal Year 2007, New Jersey peaked at 485 auditors. See State of New Jersey Budget, Fiscal Year 2008-2009 at D-425. The per auditor assessment is based on the Revised FY 2024 figure in State of New Jersey Budget, Fiscal Year 2025, at D-402.

[lxv] In Fiscal Year 2007, New Jersey peaked at 485 auditors. See State of New Jersey Budget, Fiscal Year 2008-2009 at D-425. The per auditor assessment is based on the Revised FY 2024 figure in State of New Jersey Budget, Fiscal Year 2025, at D-402.

[lxvi] In Fiscal Year 2007, New Jersey peaked at 290 auditors. See State of New Jersey Budget, Fiscal Year 2008-2009 at D-425. The per collector collection is based on the Revised FY 2024 figure in State of New Jersey Budget, Fiscal Year 2025, at D-402.

[lxvii] NJPP analysis and inflation adjustment of state budget data from fiscal years 2004 through 2024. In fiscal year 2009, assessments reached over $1.5 billion in 2024 dollars.

[lxviii] Press Release, Internal Revenue Service, IRS tops $1 billion in past-due taxes collected from millionaires; compliance efforts continue involving high-wealth groups, corporations, partnerships, July 11, 2024, https://www.irs.gov/newsroom/irs-tops-1-billion-in-past-due-taxes-collected-from-millionaires-compliance-efforts-continue-involving-high-wealth-groups-corporations-partnerships.

[lxix] Government Accountability Office, Report to the Chairman, Subcommittee on Oversight, Committee on Ways and Means, House of Representatives, Tax Compliance: Trends of IRS Audit Rates and Results for Individual Taxpayers by Income (May 2022), https://www.gao.gov/assets/gao-22-104960.pdf, pp. 10-16.

[lxx] John Reitmeyer, The List: Tracking NJ’s 10 Credit-Rating Downgrades Under Gov. Christie, NJ Spotlight News, Nov. 21, 2016, https://www.njspotlightnews.org/2016/11/16-11-20-the-list-tracking-nj-s-10-credit-rating-downgrades-under-gov-christie/.
Taxing “Super Luxury” Home Sales Could Make New Jersey Affordable for More Residents

As the cost of housing in New Jersey continues to soar, making it increasingly unaffordable for many residents, the market for “super luxury” homes – properties with exceptionally high price tags – continues to rise at a faster rate than all other homes. Applying a higher fee to the sale of these expensive homes could generate hundreds of millions in revenue, helping to make the state more affordable for low-income and middle-class residents. Crucially, this tax would be targeted exclusively to the wealthiest households.

New research from national experts suggests that adding a 4 percent tax on the sale of homes above $1 million could raise substantial revenue for the state. With New Jersey already facing a structural deficit, this new revenue source could fund vital programs that make living and raising a family in the state more affordable. These programs could include affordable housing initiatives, rental and mortgage assistance, and working family tax credits like the Child Tax Credit and Earned Income Tax Credit.

The impact of this fee would be limited to a small fraction of the housing market. Statewide, less than 10 percent of home sales exceed $1 million.[i] Levying a 4 percent tax on home sales over $2 million would affect only the top 2 percent of sales, while raising over $200 million in annual revenue for the state. Extending this same tax to homes sold over $1 million could generate hundreds of millions of dollars more for the state.

New Jersey’s existing 1 percent assessment on properties sold for over $1 million has not dampened the luxury home market. In fact, luxury home sales increased in 2023, even as overall sales declined.

Expanding the fee on very expensive homes would provide essential funding for affordable housing and critical infrastructure in New Jersey. It would also ensure that the state’s wealthiest residents, rather than low- and middle-income households, contribute their fair share to these vital resources.


End Notes

[i] Institute on Taxation and Economic Policy (ITEP) and Center on Budget and Policy Priorities (CBPP) analysis of data from Zillow, the National Association of Realtors, the U.S. Census Bureau, and various state and local agencies. Data on file with author.


Handouts to Horse Racing Industry Do Little to Benefit Working New Jerseyans

The state of New Jersey should not be in the business of subsidizing horse racing at all, let alone at a level of $20 million a year. Horse racing is not a public service, a benefit to the public at large, or frankly a benefit at all. It is, rather, a private multi-billion dollar industry, whose profits go largely to the pockets of executives and investors, not everyday New Jerseyans.

Nationally, purse amounts are substantially above pre-pandemic trend with average purse amounts at an all-time record high. Meanwhile gaming revenues and profits continue to increase. Again, it is unclear why these subsidies are needed or justified, nor whether they were needed at all in the first place.

At a time when everyday New Jerseyans continue to struggle with affordability and with the state running a structural deficit and burning through its surplus, handing $100 million to further prop up the horse racing industry puts state dollars where they are least needed.

I urge you to vote no on this bill.

Outdated and Ineffective: Why New Jersey Needs to Update Its Top Anti-Poverty Program

New Jersey’s economy has changed in many ways since the 1990s, but the state’s premier social safety net program has remained largely the same. Designed to support families with little to no income, Temporary Assistance for Needy Families (TANF) has not kept up with the rising cost of living or the evolving needs of families with children.

The program maintains outdated administrative barriers that prevent many families from receiving assistance when they need it most.[i] For the families that do qualify, the monthly grant amount remains far too low to cover basic necessities or protect against the harms of deep poverty. By updating the state’s TANF program and raising benefit levels to reflect today’s economic realities, New Jersey can help families build a more stable future for themselves, their children, and their communities.

Supporting families as they navigate financial challenges has far-reaching benefits in both the short- and long-term. Beyond the immediate relief of helping families put food on the table and keep a roof over their heads, having a stable household income increases the likelihood of children succeeding in school, pursuing higher education, and finding good-paying jobs as adults.[ii]

A stronger, more effective safety net would also help address systemic economic disparities across the state. Due to the legacy of policies that prevented people from fully participating in the economy based on their race or gender, women, Black, and Hispanic/Latinx residents of New Jersey have disproportionately lower incomes and are the least likely to afford rising costs in housing, transportation, health care, and other essential needs.[iii]

To address rising costs, deep-seeded inequities, and ensure that TANF fulfills its intended purpose, New Jersey must raise the monthly grant amount to at least 50 percent of the federal poverty level. Additionally, grant amounts should be adjusted for inflation so the program remains an effective safety net in future years. These reforms would promote stronger families and more resilient communities where everyone has the resources they need and deserve.

TANF Grant Amounts Fall Short in Today’s Economy

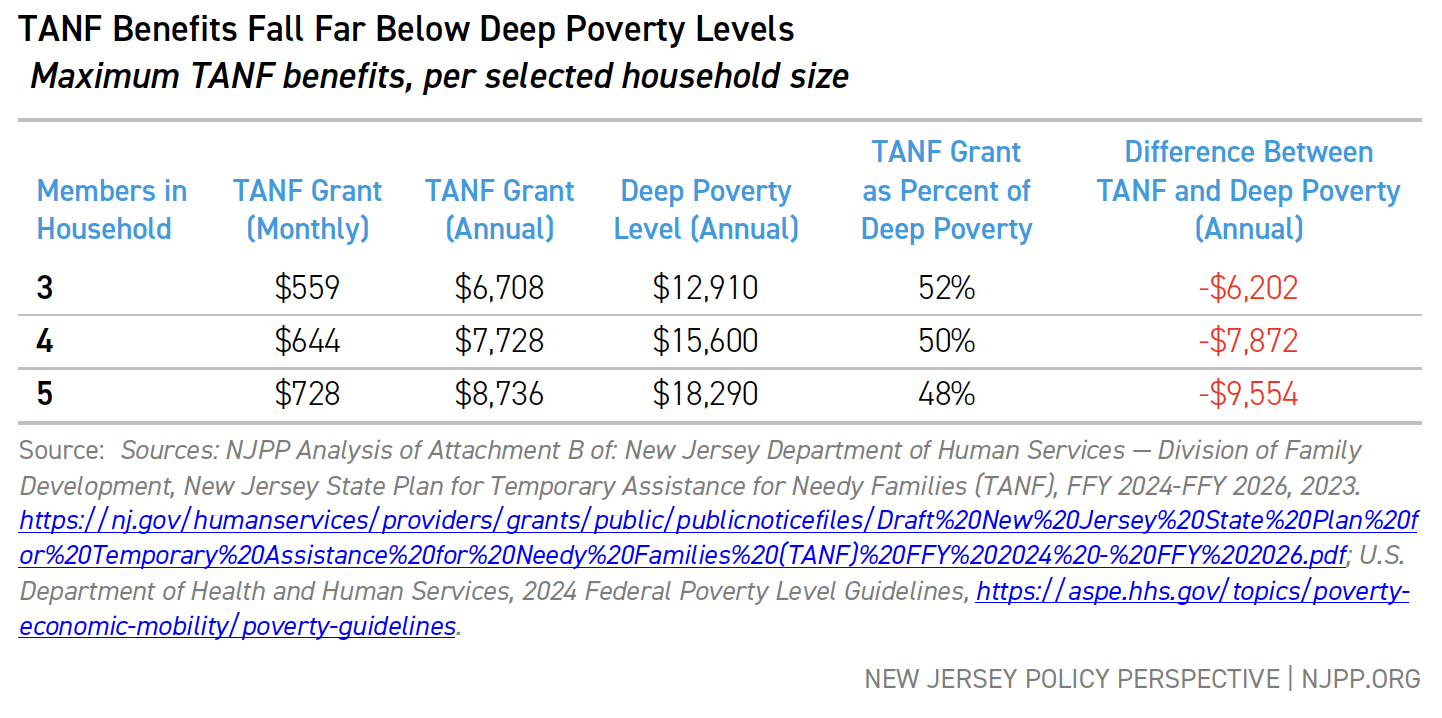
Targeted to families with the lowest incomes, New Jersey’s TANF program falls significantly short of meeting even the most basic needs, let alone enabling families to break the cycle of poverty and become self-sufficient. The current TANF grant only amounts to half of what the federal government considers “deep poverty,” which is 50 percent of the federal poverty level.[iv] Put another way, the current TANF grant in New Jersey is equal to only one-fourth of the federal government’s threshold for living in poverty. It’s worth noting that these are nationwide metrics that do not account for geographic differences in the cost of living, so this significantly undercounts the number of people living in poverty in states like New Jersey, where costs are higher.

For a family of three, the TANF monthly grant provides a maximum of $559 per month – only about $6,708 per year.[v] This is more than $6,000 below the deep poverty level.[vi] When accounting for the actual cost of living in New Jersey, a single parent with two children needs roughly $86,759 per year in order to meet their basic needs.[vii] Even excluding child care costs, a single parent with two children needs almost $63,000 per year, more than twice the federal poverty level for a family of three, to cover bills.[viii]

TANF Benefits Fall Far Below Deep Poverty Levels

New Jersey’s low TANF amount has little purchasing power in today’s economy, especially compared to when the program was created. Since 1998, New Jersey’s TANF grant has lost approximately 30 percent of its value.[ix] As a result, the assistance that a family receives each month — which used to cover the average cost of groceries with enough left over to help pay other bills and living expenses like rent — now barely covers the average cost for the month’s groceries.

New Jersey's TANF Benefits Have Lost 30 Percent of Their Value Since 1998

Without adjusting for inflation each year, families living in poverty receiving TANF cannot keep up with rising living costs to meet basic needs. Additionally, as this minimal support diminishes over time, the burden of the onerous and time-intensive application process makes it more likely that eligible families may never even apply.[x]

It’s Time to Provide Families with Enough Support to Build Their Futures

After nearly three decades, it’s time to finally update New Jersey’s TANF program so it’s a more effective safety net for families when they fall on hard times. While the program requires broader reforms to lower administrative barriers to access and eligibility, raising the grant amount is an easy and logical first step. The program’s current grant amounts are far too low, putting the health and well-being of low-income families at risk, and their ability to break the cycle of poverty out of their reach. The lack of financial assistance exacerbates housing insecurity, intensifies food insecurity, and limits access to essential health care services.[xi] Consequently, children growing up in poverty face greater challenges in school, hindering their prospects for a prosperous future and perpetuating intergenerational cycles of poverty.[xii]

In confronting the harms of deep poverty as costs continue to rise, policymakers must recognize the urgency of updating the state’s TANF program: Each day of delay for families can make a life-changing difference. By increasing the TANF grant amount, New Jersey can reaffirm its commitment to a stronger and fairer society where families have the resources necessary to overcome financial hardship and build a stable future.


End Notes

[i] While this report focuses on TANF monthly grant levels and how they are insufficient in helping families escape deep poverty, there are numerous administrative reforms needed to reduce barriers to assistance and eligibility. These include smoothing the off-ramps so that individuals do not face such steep cliffs for assistance, lowering administrative barriers to applications and documentation for the program, improving eligibility levels to better match today’s economic realities, and more. These reforms are further discussed in New Jersey Policy Perspective’s 2020 report, Promoting Equal Opportunities for Children Living in Poverty, https://www.njpp.org/publications/report/promoting-equal-opportunities-for-children-living-in-poverty/, as well as in testimony provided by New Jersey Policy Perspective to the New Jersey Legislature. These testimonies can be found on the NJPP website, such as: https://www.njpp.org/publications/testimony/its-time-for-new-jersey-to-fix-workfirst-nj-to-better-support-low-income-families/

[ii] Center on Budget and Policy Priorities, Economic Security Programs Help Low-Income Children Succeed Over Long Term, Many Studies Find, 2017. https://www.cbpp.org/research/poverty-and-inequality/economic-security-programs-help-low-income-children-succeed-over

[iii] Rutgers University – New Jersey State Policy Lab and the Center for Women and Work, Who Experienced the Greatest Financial Burden from Inflation in New Jersey? An Examination of Spending, Earnings, and Employment, 2023. https://policylab.rutgers.edu/report-release-who-experienced-the-greatest-financial-burden-from-inflation-in-nj/

[iv] UC Davis Center for Poverty & Inequality Research, What is “Deep Poverty”?, 2022. https://poverty.ucdavis.edu/faq/what-deep-poverty; Center on Budget and Policy Priorities Priorities, Chart Book: Temporary Assistance for Needy Families (TANF) at 26, 2022. https://www.cbpp.org/research/family-income-support/temporary-assistance-for-needy-families-tanf-at-26

[v] NJPP Analysis of data in Attachment B of: New Jersey Department of Human Services — Division of Family Development, New Jersey State Plan for Temporary Assistance for Needy Families (TANF), FFY 2021-FFY 2023, 2020. https://www.state.nj.us/humanservices/dfd/programs/workfirstnj/tanf_2021_23_st_plan.pdf

[vi] NJPP Analysis of Attachment B of: New Jersey Department of Human Services — Division of Family Development, New Jersey State Plan for Temporary Assistance for Needy Families (TANF), FFY 2024-FFY 2026, 2023. https://www.nj.gov/humanservices/providers/grants/public/publicnoticefiles/Draft%20New%20Jersey%20State%20Plan%20for%20Temporary%20Assistance%20for%20Needy%20Families%20(TANF)%20FFY%202024%20-%20FFY%202026.pdf; U.S. Department of Health and Human Services, 2023 Federal Poverty Level Guidelines, https://aspe.hhs.gov/topics/poverty-economic-mobility/poverty-guidelines

[vii] It is important to note that this assumes approximately the same costs for the goods and services in terms of their portion of the bills since the original report, as it is only updated to account for inflation. Note that the pandemic led to a significant increase in prices and, for some services and goods, a significant change that far outpaced that of inflation. This means that these true poverty level estimates are likely conservative estimates. Sources for calculation: NJPP Analysis of Legal Services of New Jersey, True Poverty: What It Takes to Avoid Poverty and Deprivation in the Garden State, 2021, pg. 23. https://proxy.lsnj.org/rcenter/GetPublicDocument/00b5ccde-9b51-48de-abe3-55dd767a685a; Legal Services of New Jersey, New Jersey True Poverty Tracker: A Poverty Benchmarks Report Series, 2022. https://proxy.lsnj.org/rcenter/GetPublicDocument/380358ae-ad82-43a2-8e35-cd243030dbbc.

[viii] NJPP Analysis of data from the Federal Poverty Levels (https://aspe.hhs.gov/topics/poverty-economic-mobility/poverty-guidelines) and Legal Services of New Jersey, True Poverty: What It Takes to Avoid Poverty and Deprivation in the Garden State, 2021, pg. 28. https://proxy.lsnj.org/rcenter/GetPublicDocument/00b5ccde-9b51-48de-abe3-55dd767a685a

[ix] NJPP Analysis of New Jersey state budgets and Department of Human Services report on grant amounts and inflation rates.

[x] Urban Institute, Few Families Receive the TANF Cash Assistance They’re Eligible For, 2023. https://www.urban.org/urban-wire/few-families-receive-tanf-cash-assistance-theyre-eligible

[xi] There are numerous studies and reports showing the connections between poverty and various outcomes, as well as how the effects of each issue are intertwined. See for example: Institute for Research on Poverty, Unaffordable America: Poverty, Housing, And Eviction, 2015. https://www.irp.wisc.edu/resource/unaffordable-america-poverty-housing-and-eviction/; Feeding America, Food Insecurity among Overall (all ages) Population in New Jersey, 2023. https://map.feedingamerica.org/county/2021/overall/new-jersey; Health Affairs, Health, Income, & Poverty: Where We Are & What Could Help, 2018. https://www.healthaffairs.org/do/10.1377/hpb20180817.901935/; Health Affairs, Economic Well-Being And Health: The Role Of Income Support Programs In Promoting Health And Advancing Health Equity, 2022. https://www.healthaffairs.org/doi/10.1377/hlthaff.2022.00846; New Jersey Hospital Association, New Jersey’s Most Vulnerable Communities: A Zip Code Analysis of Social Gaps and Their Impact on Health, 2019. https://www.njha.com/media/578105/CHART-NJ-Most-Vulnerable-Communities.pdf; Center for Budget and Policy Priorites, Chart Book: Housing and Health Problems Are Intertwined. So Are Their Solutions, 2022. https://www.cbpp.org/research/health/housing-and-health-problems-are-intertwined-so-are-their-solutions

[xii] For a summary of these effects, please see: The Center for Law and Social Policy, The Enduring Effects of Childhood Poverty, 2023. https://www.clasp.org/blog/the-enduring-effects-of-childhood-poverty/

New Immigrants Drive Economic Growth in New Jersey

This report was co-authored by Anthony Capote, Senior Policy Analyst at the Immigration Research Initiative, and David Dyssegaard Kallick, Director of the Immigration Research Initiative.

New Jersey’s fundamental strength lies in the rich tapestry of people who call the Garden State home, reflecting a diverse range of cultures and backgrounds. Nearly one in four residents (2.2 million) are immigrants,[i] who play a pivotal role in shaping the state’s identity.

Immigrants bring a wealth of skills and talents that enrich New Jersey’s arts, cuisine, and entertainment, add to the intellectual achievements across various fields, and play essential roles in the private and public sectors. Across the state, immigrants make significant contributions to their local communities and the broader economy through their labor, entrepreneurial endeavors, and tax contributions.

Despite the positive role immigrants play in New Jersey and around the country, there has been a rise in xenophobia and anti-immigrant policymaking in a number of states. It is imperative for New Jersey to uphold its values of inclusivity and support for immigrants. Championing “Fair and Welcoming” policies that lower barriers to essential public services and protect residents from discrimination and workplace abuses is not just a moral obligation but a strategic necessity for bolstering the state’s economy.

To measure the economic contributions of new immigrants, this research brief by New Jersey Policy Perspective and the Immigration Research Initiative models the long-term economic outcomes for newly arrived immigrants and projects that there will be significant wage earnings and tax contributions in their first year of arrival and even more over the long run.

Newly Arriving Immigrants Immediately Get to Work and Contribute to the Economy

Newly arriving immigrants face multiple challenges as they navigate language barriers, adapt to unfamiliar cultures and systems, and adjust to a new way of life. Despite these challenges, many swiftly integrate into the workforce within their first year. As a result, each 1,000 new immigrants can be expected to earn a combined $21 million in annual wages, enhancing the economic vitality of their communities where they work and amplifying local spending power where they live. After five years, the same 1,000 immigrants can be expected to increase their wages by about 57 percent, totaling $33 million in aggregate wages.

New Immigrants Work and Pay Taxes - Table outlining the aggregate wages and state/local taxes paid per 1,000 during the first year and after 5 years.

As immigrants settle in and establish their roots in New Jersey, state and local tax revenues see an uptick. For every 1,000 workers, state and local tax revenues are poised to increase by $1.8 million. Over the span of approximately five years, each 1,000 newly arrived immigrants collectively add to state and local tax revenues a total of $2.9 million, a 61 percent increase from their initial year. Such increases in state and local tax revenues translate into broader benefits for all residents, providing additional funding for schools, libraries, transit infrastructure, and other public goods.

However, more work remains to be done at the federal level to reduce barriers to work authorization for newly arriving immigrants. Earnings and tax contributions are contingent upon pathways to work authorization, and for those unable to gain work authorization, the trajectory toward upward mobility is much more limited.

Supporting Immigrants Makes New Jersey Stronger and Fairer for All

New Jersey’s commitment to inclusivity and fairness is evident through past policies that extend vital resources such as driver’s licenses, health care for all kids, language services, and pandemic relief to all, regardless of their immigration status. As a state built on diversity and resilience, it is critical to reaffirm this commitment as a beacon of hope for those fleeing persecution and seeking refuge.

Lawmakers must translate these values into tangible action, aligning state policies with equity and hospitality by improving immigrants’ wages and lowering barriers to health care, legal services, quality education, affordable housing, and more. By doing so, New Jersey can be a stronger and fairer state where everyone is valued, protected, and given a chance to thrive.


End Notes

[i] 2022 American Community Survey data, https://www.census.gov/programs-surveys/acs/data.html.


Methodology

To model the likely outcomes for new arrivals, IRI looked at immigrants in New Jersey who had been in the country for less than two years, and who do not speak English very well.

To model the outcome for those who have been here for approximately five years, we expanded the analysis to include those who speak English “very well,” but did not include those who speak “only English” at home, reflecting the fact that most — though not all — immigrants learn to speak the language very well within five years. We did not include in the analysis people who speak “only English” at home. To get a robust sample size, IRI looked at two years for new arrivals and five to ten years for those who have been here longer.

The tax analysis is based on a simple use of the Institute on Taxation and Economic Policy report, “Who Pays: A Distributional Analysis of the Tax Systems in All 50 States.” According to the most recent, 7th Edition, the bottom 20 percent of tax filers in New Jersey pay 8.8 percent of their income in state and local taxes. We use this as the effective tax rate for newly arriving immigrants as well as for those who have been here for five years.

Many, but not all, of the workers would have work authorization. Many newly arriving immigrants are eligible to apply for Temporary Protected Status, humanitarian parole, asylum, or other designations that give them temporary or permanent work permits. The Institute on Taxation and Economic Policy’s related report, “Undocumented Immigrants’ State and Local Tax Contributions,” shows that immigrants without work authorization pay an effective tax rate of 7.7 percent in New Jersey, a little lower than those with work authorization. The overall tax estimate might be increased by some families with incomes on the higher range, and decreased some by the proportion of immigrants who are undocumented.

About the Authors

Marleina Ubel is a senior policy analyst at New Jersey Policy Perspective.

Anthony Capote is a senior policy analyst at the Immigration Research Initiative.

David Dyssegaard Kallick is director of the Immigration Research Initiative.

Family Leave Expansion Is Good for Business, Improving Retention and Reducing Labor Costs

Good morning, Chair and thank you to the committee for allowing me to testify today. Despite lobbyist claims to the contrary, family leave expansion is good for business, improving retention and reducing labor costs.

1) When family leave and job protection expand, businesses show no negative effects and report slightly positive impact on employer ability to deal with employee absences. Two large studies on employers in states with paid leave show that the vast majority of businesses show no negative impact on their business operations. Most employers report positive or “no effect” on business outcomes. Smaller businesses were actually less likely to report negative effects.

New Jersey-specific research from the initial implementation of paid leave showed similar results, showing minimal impact on profitability, productivity, or turnover after paid leave

2) Most businesses support, rather than oppose, expansions in family leave protection. Despite business interest group opposition to paid leave expansion, surveys of actual businesses routinely show majority support for increasing paid family leave. In one poll from 2017, surveyed small business owners (who were disproportionately white, male, and Republican) showed 71% support for expanding job protection to smaller businesses.

3) Family leave use helps, rather than hurts, small businesses. Research from other states shows that small firms experience a reduction in labor costs when workers use paid leave.

As prior testimony and legislator statements made clear, turnover at small firms can be much more damaging than at large firms where employees are more easily replaced. But this actually militates in favor of family leave job protection at small firms, because encouraging paid leave lowers turnover and increases retention of employees. When leave was implemented, wage costs did not go up, while turnover rates went down, with no effect on firm closure.

The doomsday scenarios painted by the business lobby have not come to pass in previous family leave and job protection expansion, nor in states without New Jersey’s onerous job protection restrictions.

For the Many NJ: Governor Murphy Gives Ultra Wealthy Corporations $1 Billion, Passes Cost to Transit Riders

New Jersey Transit announced their plan today to make up for budget shortfalls, including a $119 million shortfall in fiscal year 2025, by raising fares. This comes on the heels of Governor Murphy’s decision to deliver a $1 billion tax cut to the wealthiest corporations in the state by refusing to renew the Corporate Business Tax surtax earlier this month. For the Many NJ releases the following statement in response:

Eric Benson, Campaign Director, For The Many NJ:

“Fare hikes on everyday New Jerseyans does nothing to make the state more affordable and shows why we need to have fair sustainable revenue like the Corporation Business Tax surtax. While big corporations are getting $1 billion in tax cuts, New Jersey’s leaders have no plan to fill budget holes and instead are throwing the costs to working families.

If the Governor and legislature don’t get serious about raising revenues from the wealthy and powerful, it will be the working- and middle-class residents of the state who end up paying the price.”

# # #

For The Many NJ is a statewide coalition of more than 30 organizations working to expand funding for essential services and improve budget practices to meet current and future needs, especially for communities that have been historically left behind.

Governor’s Stronger and Fairer Economy Can’t Overlook Fiscal Elephant

Today, Governor Phil Murphy delivered his sixth annual State of the State address, where he focused on ways to make New Jersey the best place anywhere to raise a family. The speech highlighted the critical role of state government in building an economy that works for everyone, but the governor did not address how the state would pay for these investments after lawmakers allowed the Corporate Business Tax surcharge to expire at the start of the year. In response to the address, New Jersey Policy Perspective (NJPP) released the following statement.

Nicole Rodriguez, President, NJPP:

“There’s a lot to like in Governor Murphy’s address, from protecting rights and freedoms to promoting affordability and economic security. This approach to governing recognizes the critical role of state government in making New Jersey the best place to live, go to school, raise a family, or start a business. The last six years are more than enough proof that this model works, and that we can strengthen public services and have a booming economy at the same time.

“But just as the governor attributed this success to confronting New Jersey’s financial challenges, his address overlooks one giant elephant in the room that could unravel it all. As it stands, New Jersey is not raising enough revenue to balance its current budget, and the state’s financial outlook is made worse thanks to a new billion-dollar corporate tax cut that just went into effect.

“By scrapping the corporate tax surcharge for big players like Amazon and Walmart, state lawmakers jeopardize the future of the same investments the governor celebrated in his remarks. To keep up the momentum and build an economy that is truly stronger and fairer for all, Governor Murphy and the Legislature must undo this tax cut for the most profitable corporations in the world.”

# # #