Executive SummaryThere is growing consensus among New Jersey’s legislators, school leaders, educators, and other stakeholders: It’s time for the legislature to implement long-needed changes to its K-12 funding law, the School Funding Reform Act (SFRA). This report provides guidance for revising SFRA, focusing specifically on the issue of school revenues. New Jersey’s local property taxes are less regressive than in neighboring states; this is, in no small part, due to the state school aid provided by SFRA. However, funding for schools has declined as a percentage of the state’s economy, suggesting there is room for improvement. To raise adequate funding, SFRA advises a local contribution from each school district; however, the calculation of that “Local Fair Share” (LFS) is not transparent, resulting in local tax inequities across otherwise similar school districts. Specifically, this report examines how factors other than district wealth affect tax equity. Although the former Abbott districts pay less than similar districts in school taxes, their overall local tax burden (which includes municipal taxes) is similar. Disturbingly, districts with larger populations of students of color, especially Latinx/Hispanic students, pay much higher total tax rates than similarly wealthy districts. This report also finds that districts with larger shares of non-residential property raise more local revenue, even though districts are expected to contribute less under SFRA. Given these findings, this report recommends that New Jersey reevaluate the revenue calculations in SFRA, paying particular attention to the effects on tax equity that arise from setting the property and income rates. The Department of Education should develop a set of indicators to monitor school property tax, total property tax, and overall tax equity, both at the local and state level. Given this report’s findings of inequitable tax rates for communities of color, these indicators should evaluate disparities in tax rates by race, ethnicity, and income. This report also recommends that, once valid and equitable LFS amounts are calculated, localities should be required by the state to provide that share to their schools if they are below their adequacy threshold — adequacy as defined as the amount of funding needed for a school district to provide a constitutionally mandated, high-quality education — with the understanding that the state will also provide the aid needed for districts to reach their adequacy targets. Districts facing tax increases should be able to phase in those increases over time. To aid in the collection of these local revenues, non-residential properties should be taxed at the regional or state level, allowing for a more equitable distribution of revenues to the districts where they are most needed. Finally, this report’s appendices include an update of earlier work focused on “adequacy” with a new analysis that supports previous recommendations: SFRA needs to be adjusted to provide more funding to the highest-poverty districts if they are to meet current, more rigorous standards. |
Introduction
New Jersey’s public schools rely on a complex system of funding, drawing primarily from local and state taxes, with federal contributions playing a smaller, yet important, role. In 2008, the state’s School Funding Reform Act (SFRA) was enacted to ensure equitable distribution of state resources, particularly for districts with higher levels of poverty. However, the application of SFRA’s Local Fair Share (LFS) formula — determining how much a community should contribute based on its wealth and tax capacity — has led to significant disparities in local taxes.
In 2024, school funding became a contentious issue in New Jersey. Even as the state moved toward fully funding SFRA, some local districts objected to cuts in state aid. While subsequent legislation provided some relief to some of these districts, there is growing consensus that SFRA needs to be overhauled. Lawmakers are expected to propose changes to the formula at the heart of SFRA.
This report focuses on the revenue side of SFRA, examining how much the state expects school districts to raise through local property taxes. Specifically, it offers: (1) guidance on how to set valid “Local Fair Share” amounts for school districts, recognizing that different communities have varying capacities to raise local funds for schools; (2) recommends that SFRA should direct more state aid to communities that maintain relatively high tax rates but have lower property values, limiting their capacity to raise sufficient funds; and (3) suggests that the formula should set local fair share amounts that avoid regressive and inequitable tax rates, while ensuring that schools can secure the necessary revenues to provide a high-quality education.
Before the legislature begins this work, it’s important to take a step back and remember who SFRA affects and why its design is essential not only for school districts but all of New Jersey’s residents. Like all state school funding systems, SFRA was designed with two constituencies in mind:
- Students, who need adequately funded schools to receive a quality education
- Taxpayers, who should be taxed fairly based on their ability to pay
Regarding students: Statewide school funding systems, like New Jersey’s SFRA, are premised on the fact that different students in different contexts require different amounts of funding to reach the state’s outcome goals. For example, decades of research have shown that students in poverty, on average, require more resources in schools to achieve the same outcomes as more affluent students.[i] Students whose native language is not English or students with learning disabilities also require more resources to have more equitable educational opportunities.[ii]
Based on this research, New Jersey should be driving more resources toward school districts serving a greater number of students in poverty. In the decade before the Great Recession of 2008, the state was, in fact, doing just that: high-poverty districts were, on average, receiving considerably more revenues than low-poverty districts. This changed in 2010 by the end of the Christie administration when New Jersey’s highest- and lowest-poverty school districts were spending roughly the same amount per pupil. Appendix A presents more details.
SFRA was supposed to address the needs of higher-poverty school districts by setting higher funding targets for those districts. However, as previous reports have detailed, New Jersey still does not provide enough revenue for its highest-poverty school districts to meet the state’s current, rigorous educational goals.[iii] Appendix B includes an updated analysis of SFRA’s adequacy targets, revealing that the poverty weights in SFRA continue to be too low to meet state constitutional requirements.
Regarding taxpayers: A fair school funding system considers the wide differences in “tax capacity” — the ability to raise local revenues — between school districts. Keep in mind that local school revenues are raised almost entirely through property taxes. Districts with higher property values, per pupil, have an advantage over others: they can raise the necessary revenue to fund their schools without having to raise tax rates as high as districts with lower property values. Overall, districts with lots of property wealth can maintain relatively low tax rates while still generating the revenue their schools need.
SFRA was adopted, in part, to smooth out unevenness in school funding by providing statewide, systematic, and predictable adequacy budgets for all districts and children — not just the districts that were party to litigation. But SFRA also sets the share of those adequacy budgets that school districts will fund through local property taxes. By setting targets for spending and local revenue, SFRA attempts to allocate state revenues so that school funding is both adequate for students to receive an excellent education and fair for taxpayers.
Paying For Public Schools in New Jersey
Schools rely on three primary sources of revenue: local, state, and federal. As shown below (Figure 1), federal funding is a relatively small part of overall revenues. The majority of federal funding is allocated through programs such as Title I, which drives more revenues toward districts with higher poverty rates. These funds are supposed to “supplement, not supplant” other sources of funding.[iv] As a result, school funding systems focus primarily state and local revenue sources.
Figure 1
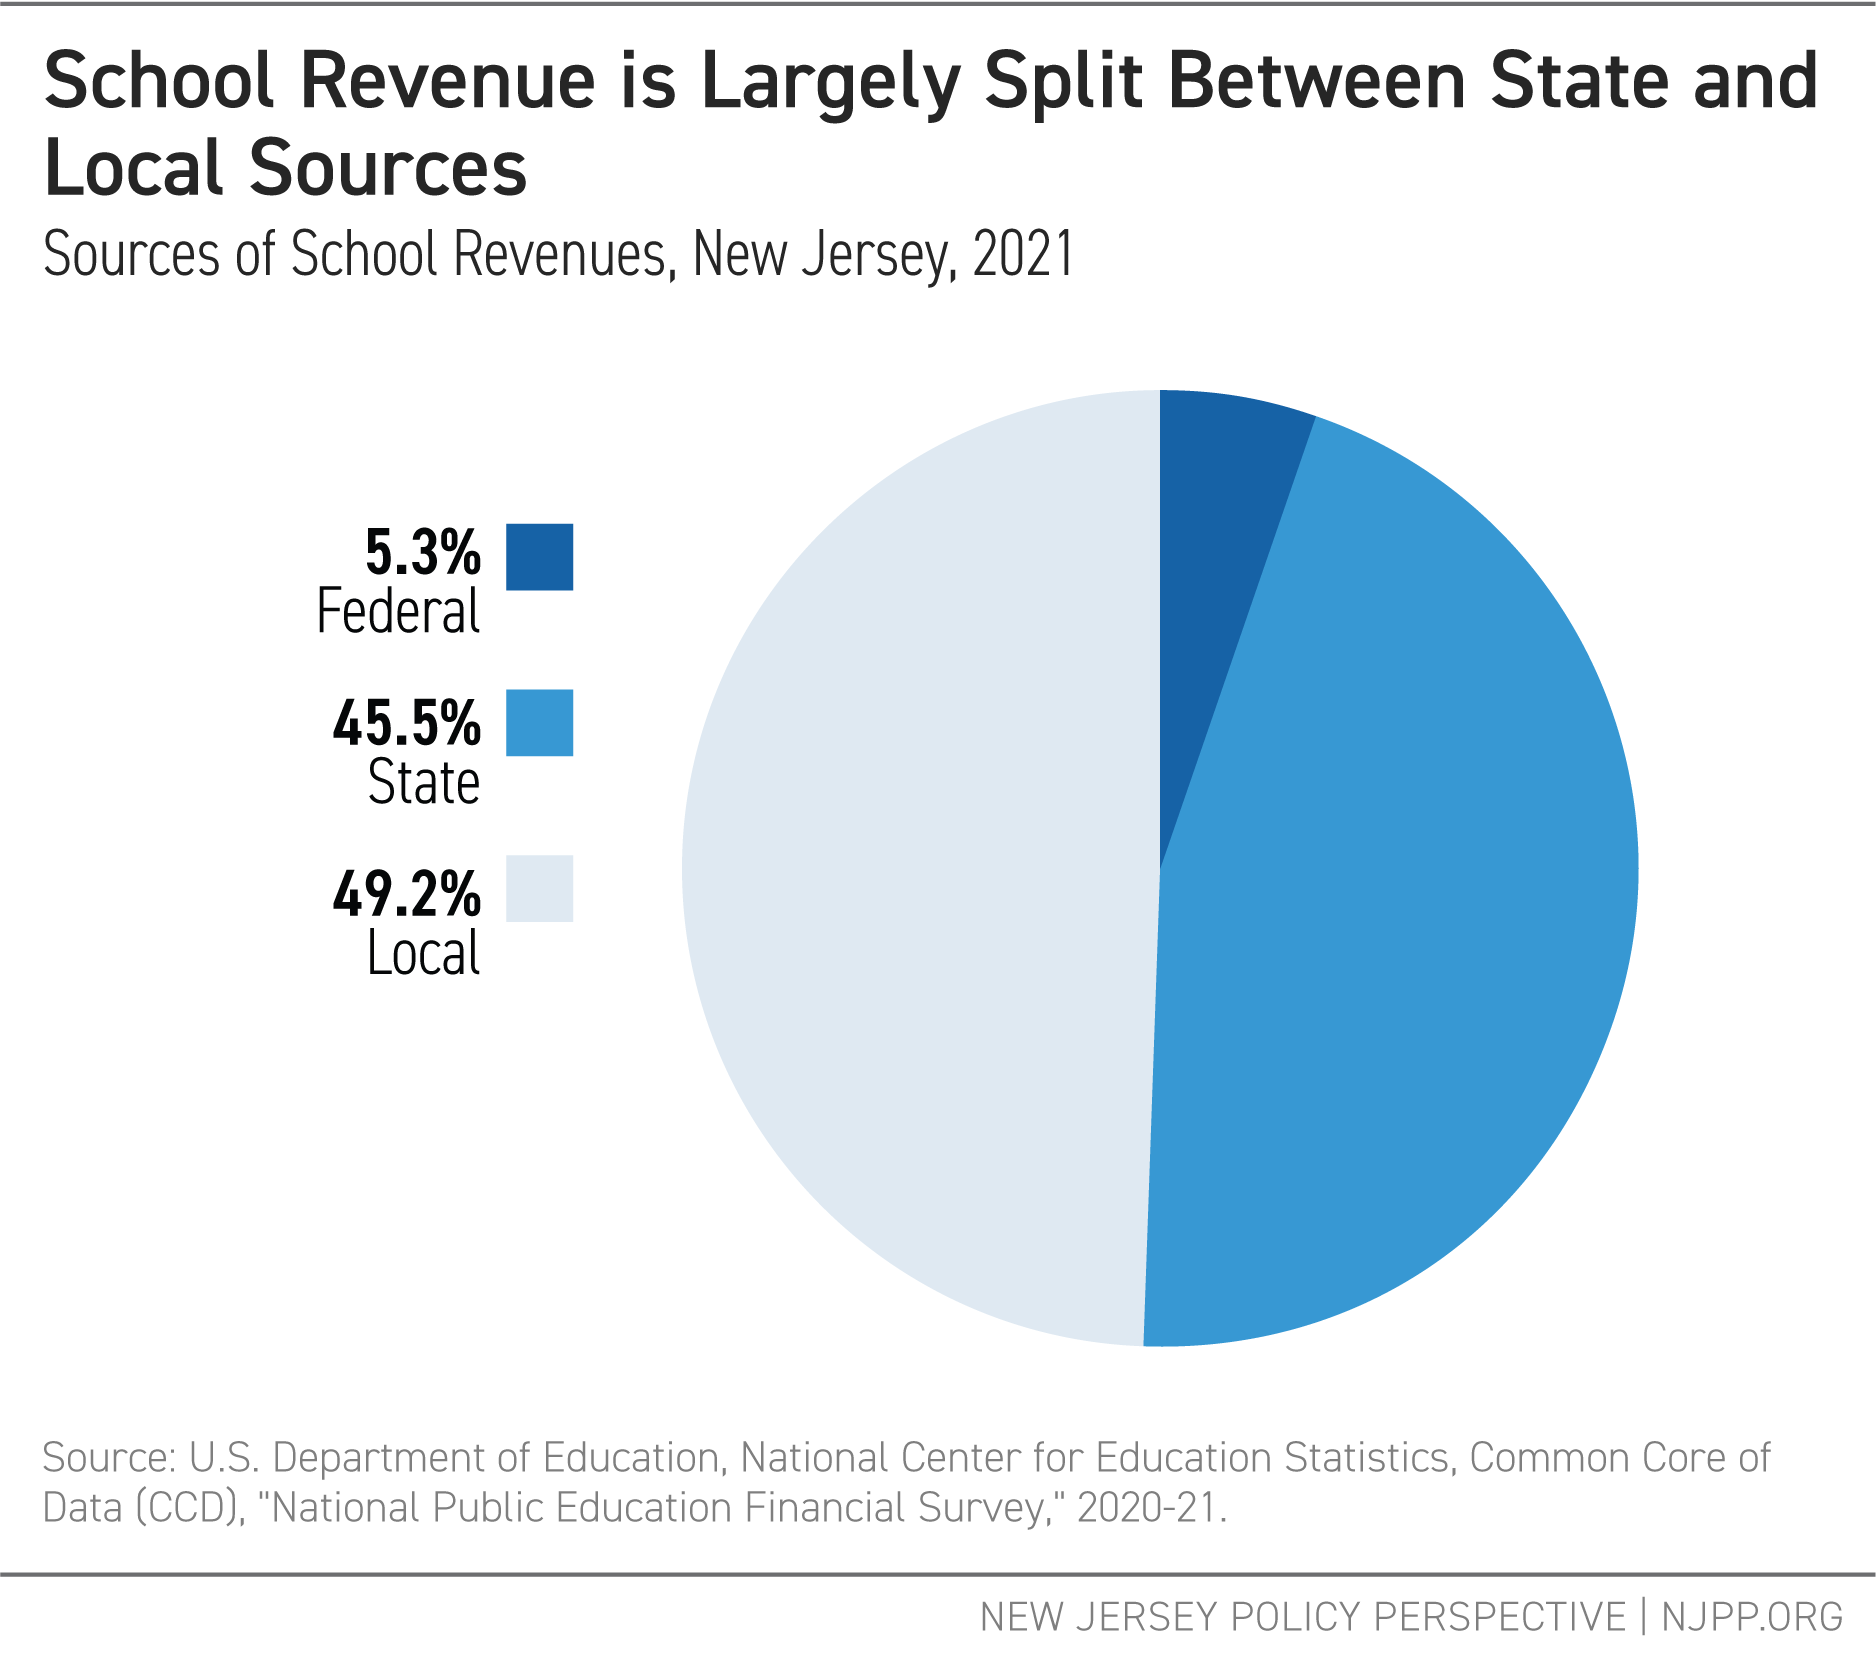
Although overall school revenues in New Jersey are split nearly evenly between state and local taxes, the reliance on each revenue source varies widely across individual districts. SFRA requires more affluent districts to contribute more local funding to their schools because they have greater capacity to do so. Some districts get nearly all of their funding from local sources because they have greater property wealth and, therefore, greater tax capacity. Others get the majority of their revenues from the state because their property wealth and, therefore, tax capacity is relatively low. This approach helps to reduce the regressivity of New Jersey’s taxes; however, the current configuration of SFRA still results in substantial inequities in local property taxes. Correcting these inequities, which this report describes below, should be a primary objective of any reforms to SFRA.
To illustrate how different towns have different tax capacities, Table 1 shows data for three towns in Essex County. Millburn, which has very low child poverty, also has very high property values per pupil. Irvington, a town with high poverty, has comparatively low property values, while Belleville falls between the two. Because Irvington has much lower property values, it would have to tax itself at a much higher rate than Millburn to generate the same amount per pupil. In this illustration, the three districts all aim to raise $10,000 per pupil; but Irvington’s tax rate would need to be six times higher than Millburn’s to raise the same amount.
Table 1:
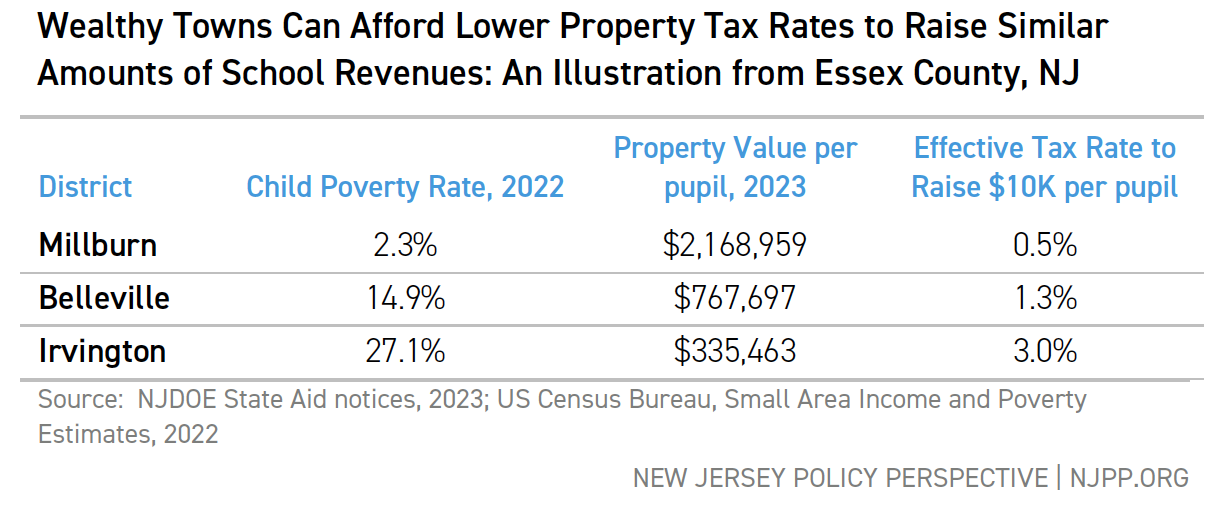
As this example shows, without state aid, districts with low property values would have to pay much higher effective tax rates to fund their schools compared to districts with high property values. SFRA addresses this disparity by calculating a Local Fair Share (LFS): an amount local districts are expected to raise without imposing an undue tax burden. This report explores how SFRA calculates LFS, and how it could improve that calculation.
Appendix C further discusses the mix of taxes states use to fund schools, and the relative advantages or disadvantages of different revenue sources. To summarize: even though property taxes can be regressive, there are good reasons to include them in the mix of revenues used to fund schools. In a related analysis, Appendix D explores New Jersey’s tax effort: the percentage of the state’s economy devoted to K-12 education. Relative to other states, New Jersey does make a strong effort to fund its schools; however, given the decrease in effort following the Great Recession of 2008, there is still room for improvement.
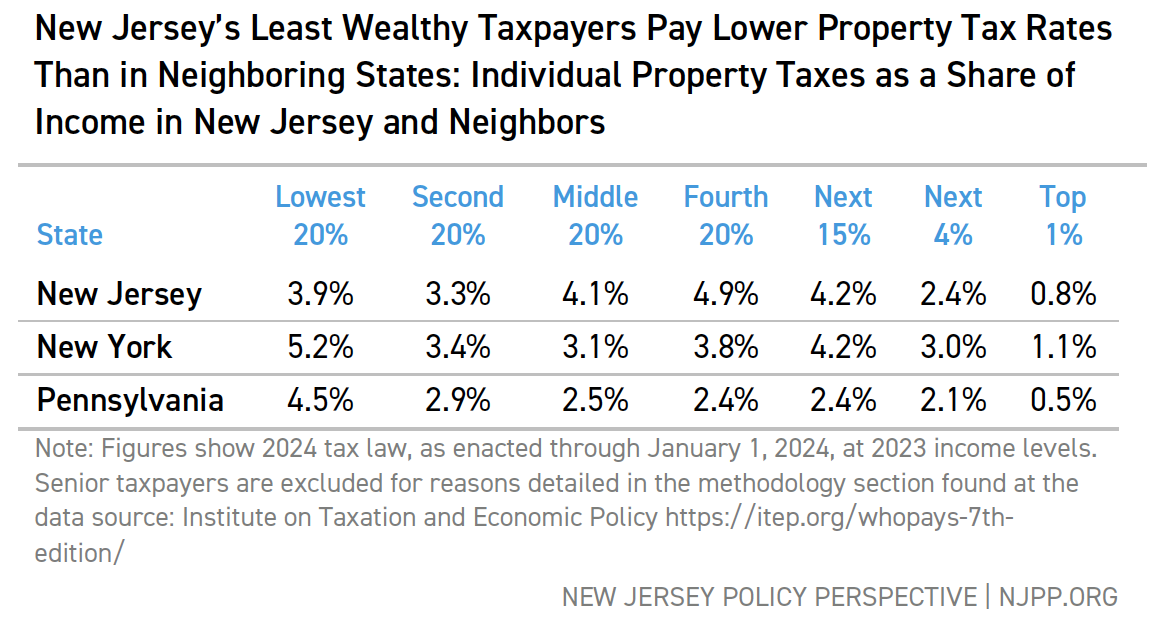
Tax Progressivity in New Jersey and Its Neighbors
A tax system can be classified as either “progressive” or “regressive.” In a progressive tax system, taxes increase as income rises, whereas a regressive tax system requires low-wage workers to pay a greater share of their income in taxes than those with higher incomes. Because different taxes have different effects on tax equity, the mix of tax types in a state will affect its tax progressivity: the average differences in total effective tax rates for taxpayers of different incomes.
It is useful to compare New Jersey to its neighbors when assessing tax progressivity. Table 2 shows that individual property taxation in New Jersey is generally less regressive than Pennsylvania’s, and the lowest-income residents in New Jersey pay lower tax rates than their counterparts in New York. Any reforms of SFRA should not undermine this relative tax progressivity.
Table 2:
 Local Fair Share
The core of SFRA’s revenue calculation is Local Fair Share (LFS). The theory behind SFRA’s LFS formula is that there is “fair” amount each community should pay to fund its schools, based on its capacity to raise revenues through local taxes. Once that amount is set, the state then comes in and provides additional funding to help school districts reach their adequacy targets. It’s important to note that until FY 2025, some districts have never received the full funding they were entitled to under SFRA to reach those targets.
Although local school revenues are almost entirely collected through property taxes, the school district’s tax capacity is determined by more than just property values. The LFS formula is:
Local Fair Share = [(District Aggregate Property Value * Property Rate) + (District Aggregate Personal Income * Income Rate)] / 2
Again, the theory behind LFS is that communities with less wealth — and, therefore, less tax capacity — should receive more state aid to fund their schools as they generate less from local property taxes than wealthier communities. This approach aims to make tax rates less regressive, if not fully progressive. However, in practice, the outcome doesn’t always align with this theory. To illustrate, we return to our three districts in Essex County, as shown in Table 3.
Table 3:
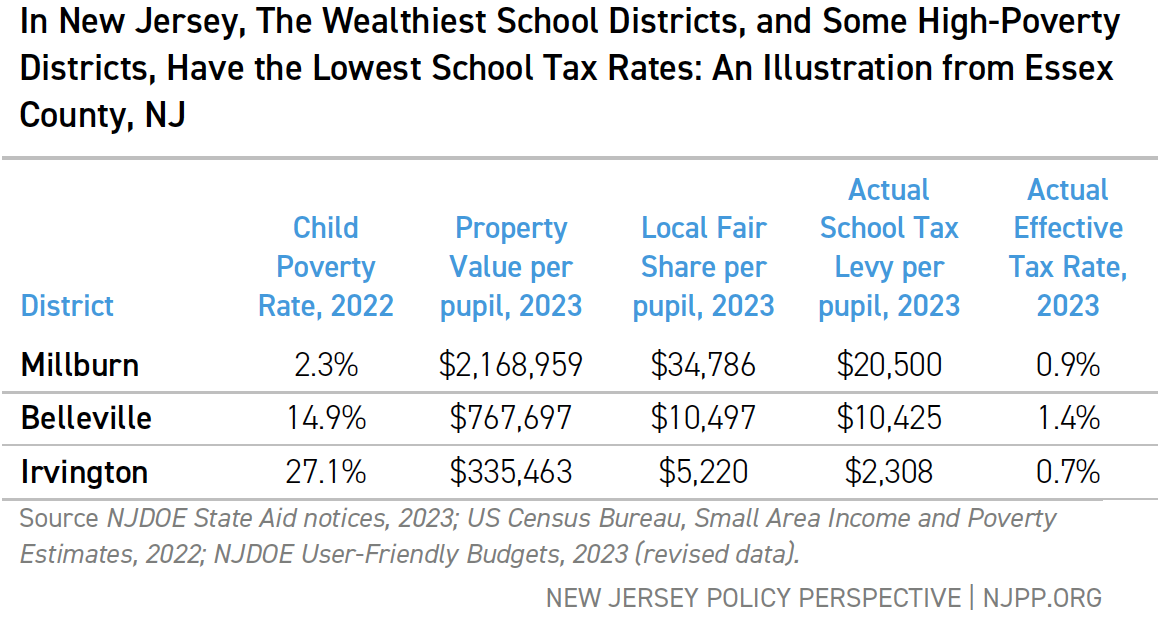
As expected, Millburn, with its significant property wealth, has a much higher LFS than Belleville, which in turn has a larger LFS than Irvington. But Millburn’s actual tax levy falls well below its LFS; this affluent town doesn’t need to raise taxes to its LFS level to adequately fund its schools and maintain its status as a high-performing district. Belleville, on the other hand, raises nearly exactly what its LFS calls for and has the highest effective school tax rate among the three communities. Unlike Irvington, Belleville was not party to the Abbott rulings; as discussed below, Abbott districts tend to have lower effective school tax rates than non-Abbott districts like Belleville. However, the total tax rates are not systemically lower in Abbott districts (see below), a crucial point when discussing how SFRA should calculate LFS.
Local Fair Share and Taxes
As mentioned above, the SFRA formula calculates a town’s LFS by multiplying its total property value by a property rate, and its total personal income by an income rate. The Education Commissioner determines both the property rate and the income rate. These rates vary annually and play a significant role in determining a district’s LFS and, consequently, the amount of state aid each district receives. By adjusting the rates, the Commissioner has the power to substantially alter the distribution of state aid to schools.
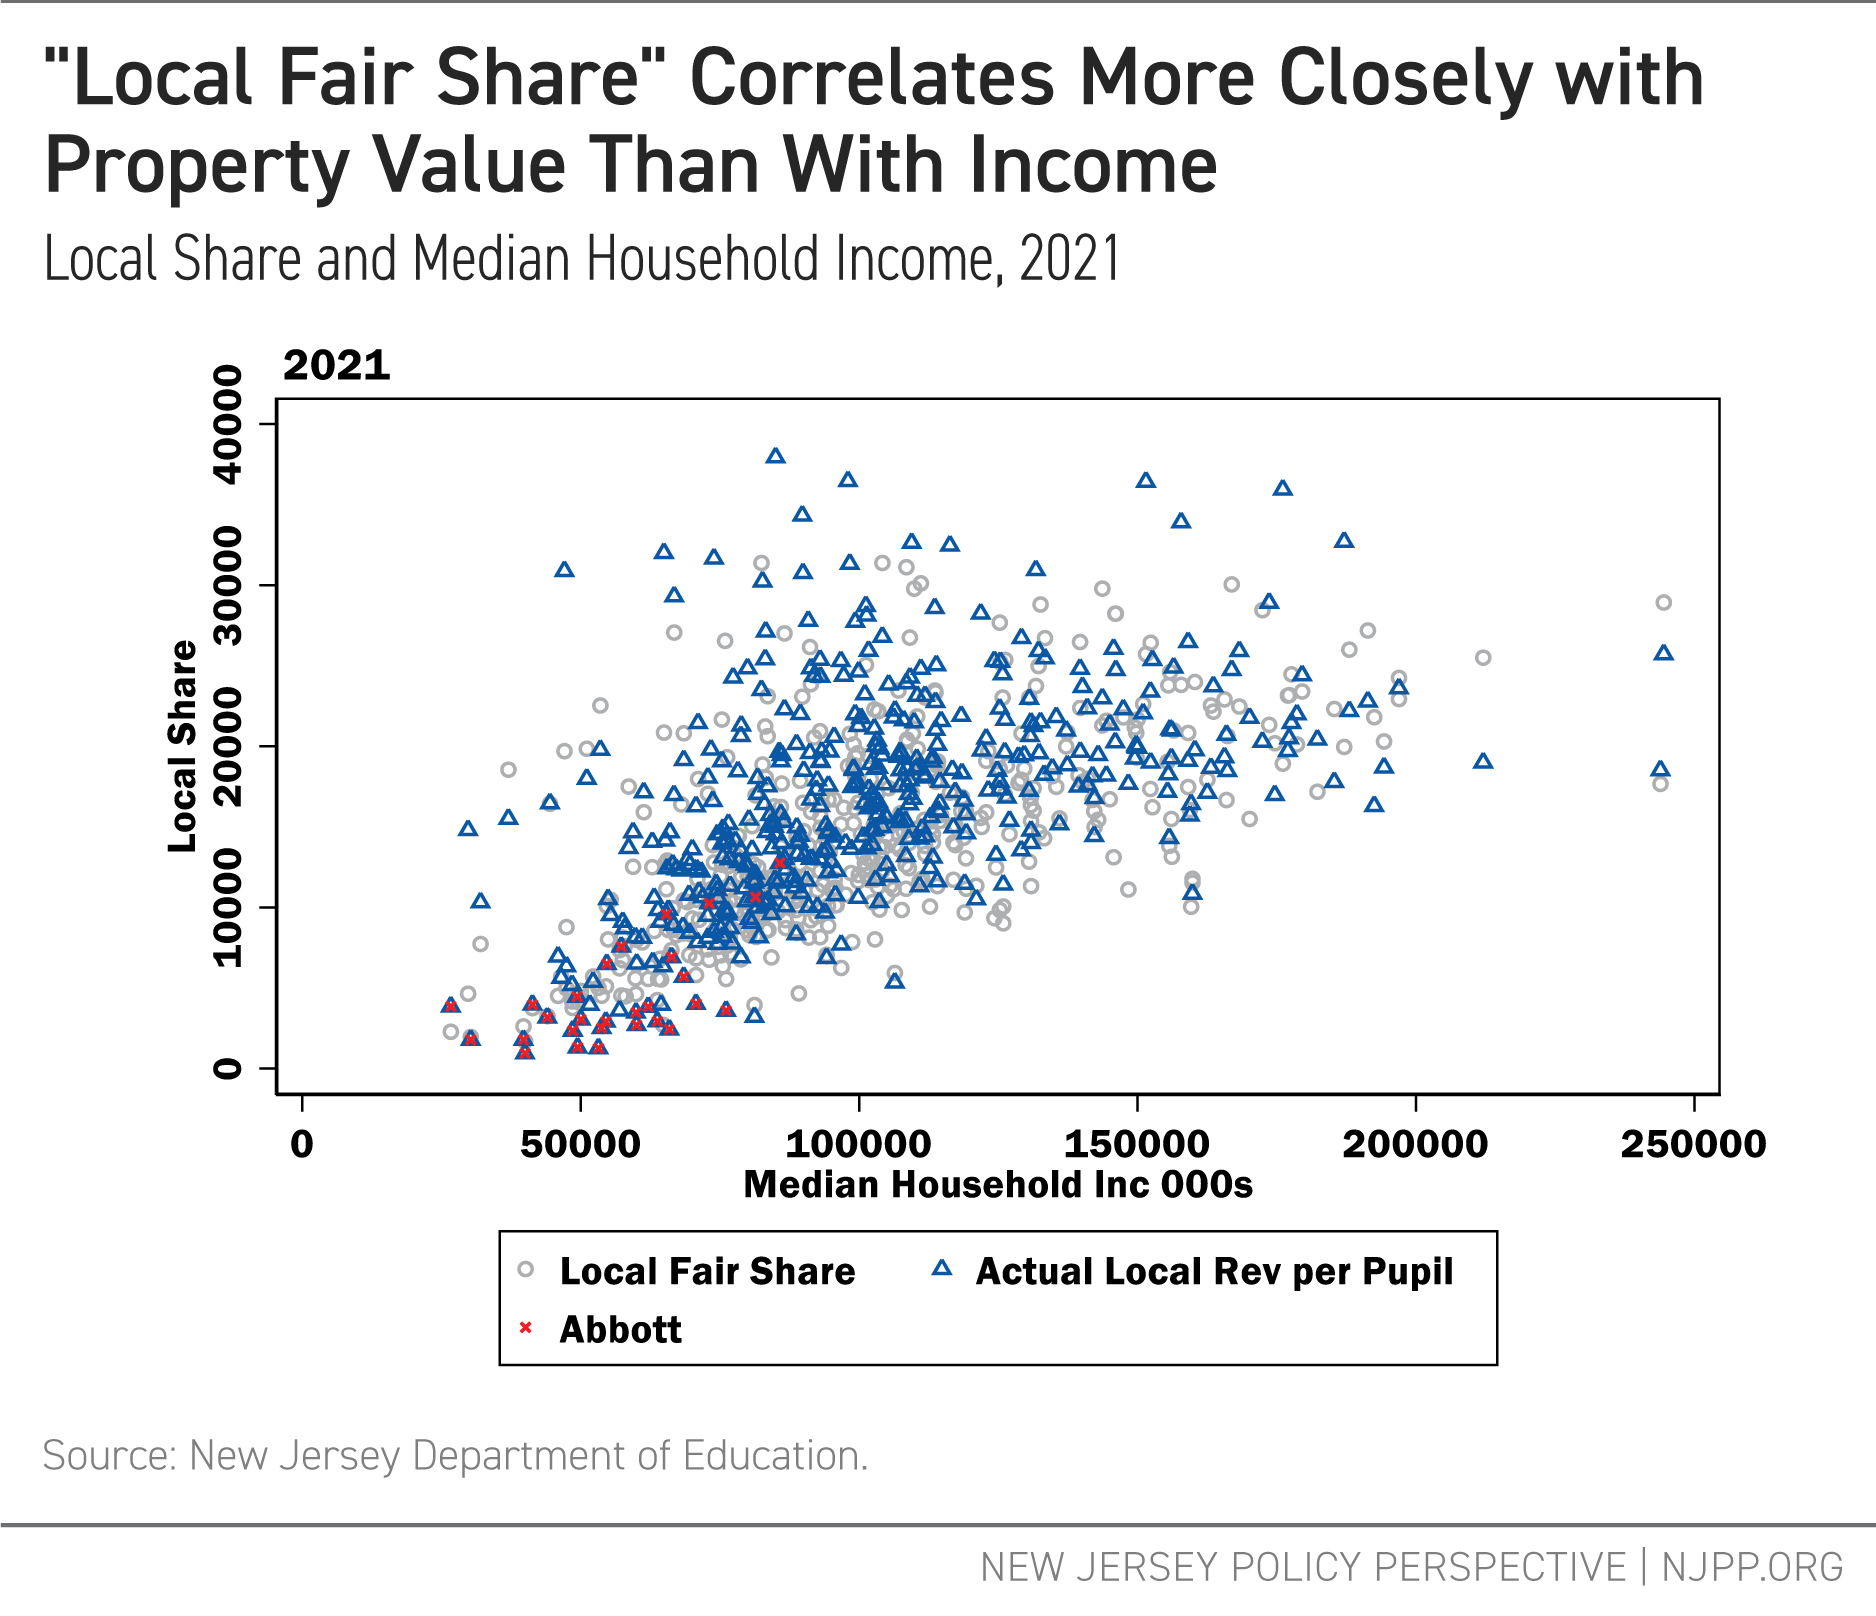
To illustrate the differences between property values and income as used in SFRA, Figure 2 shows (a) local fair share and (b) actual local revenue per pupil in relation to taxable property wealth per pupil; Figure 3 presents the same data but in relation to median household income. Overall, as property values or income increases, LFS and actual revenue also rise. However, the relationship between local fair share and taxable property wealth is stronger than the relationship between local fair share and median household income.[v] Likewise, the relationship between actual revenues and property wealth is stronger than the relationship between actual revenues and income.
Figure 2
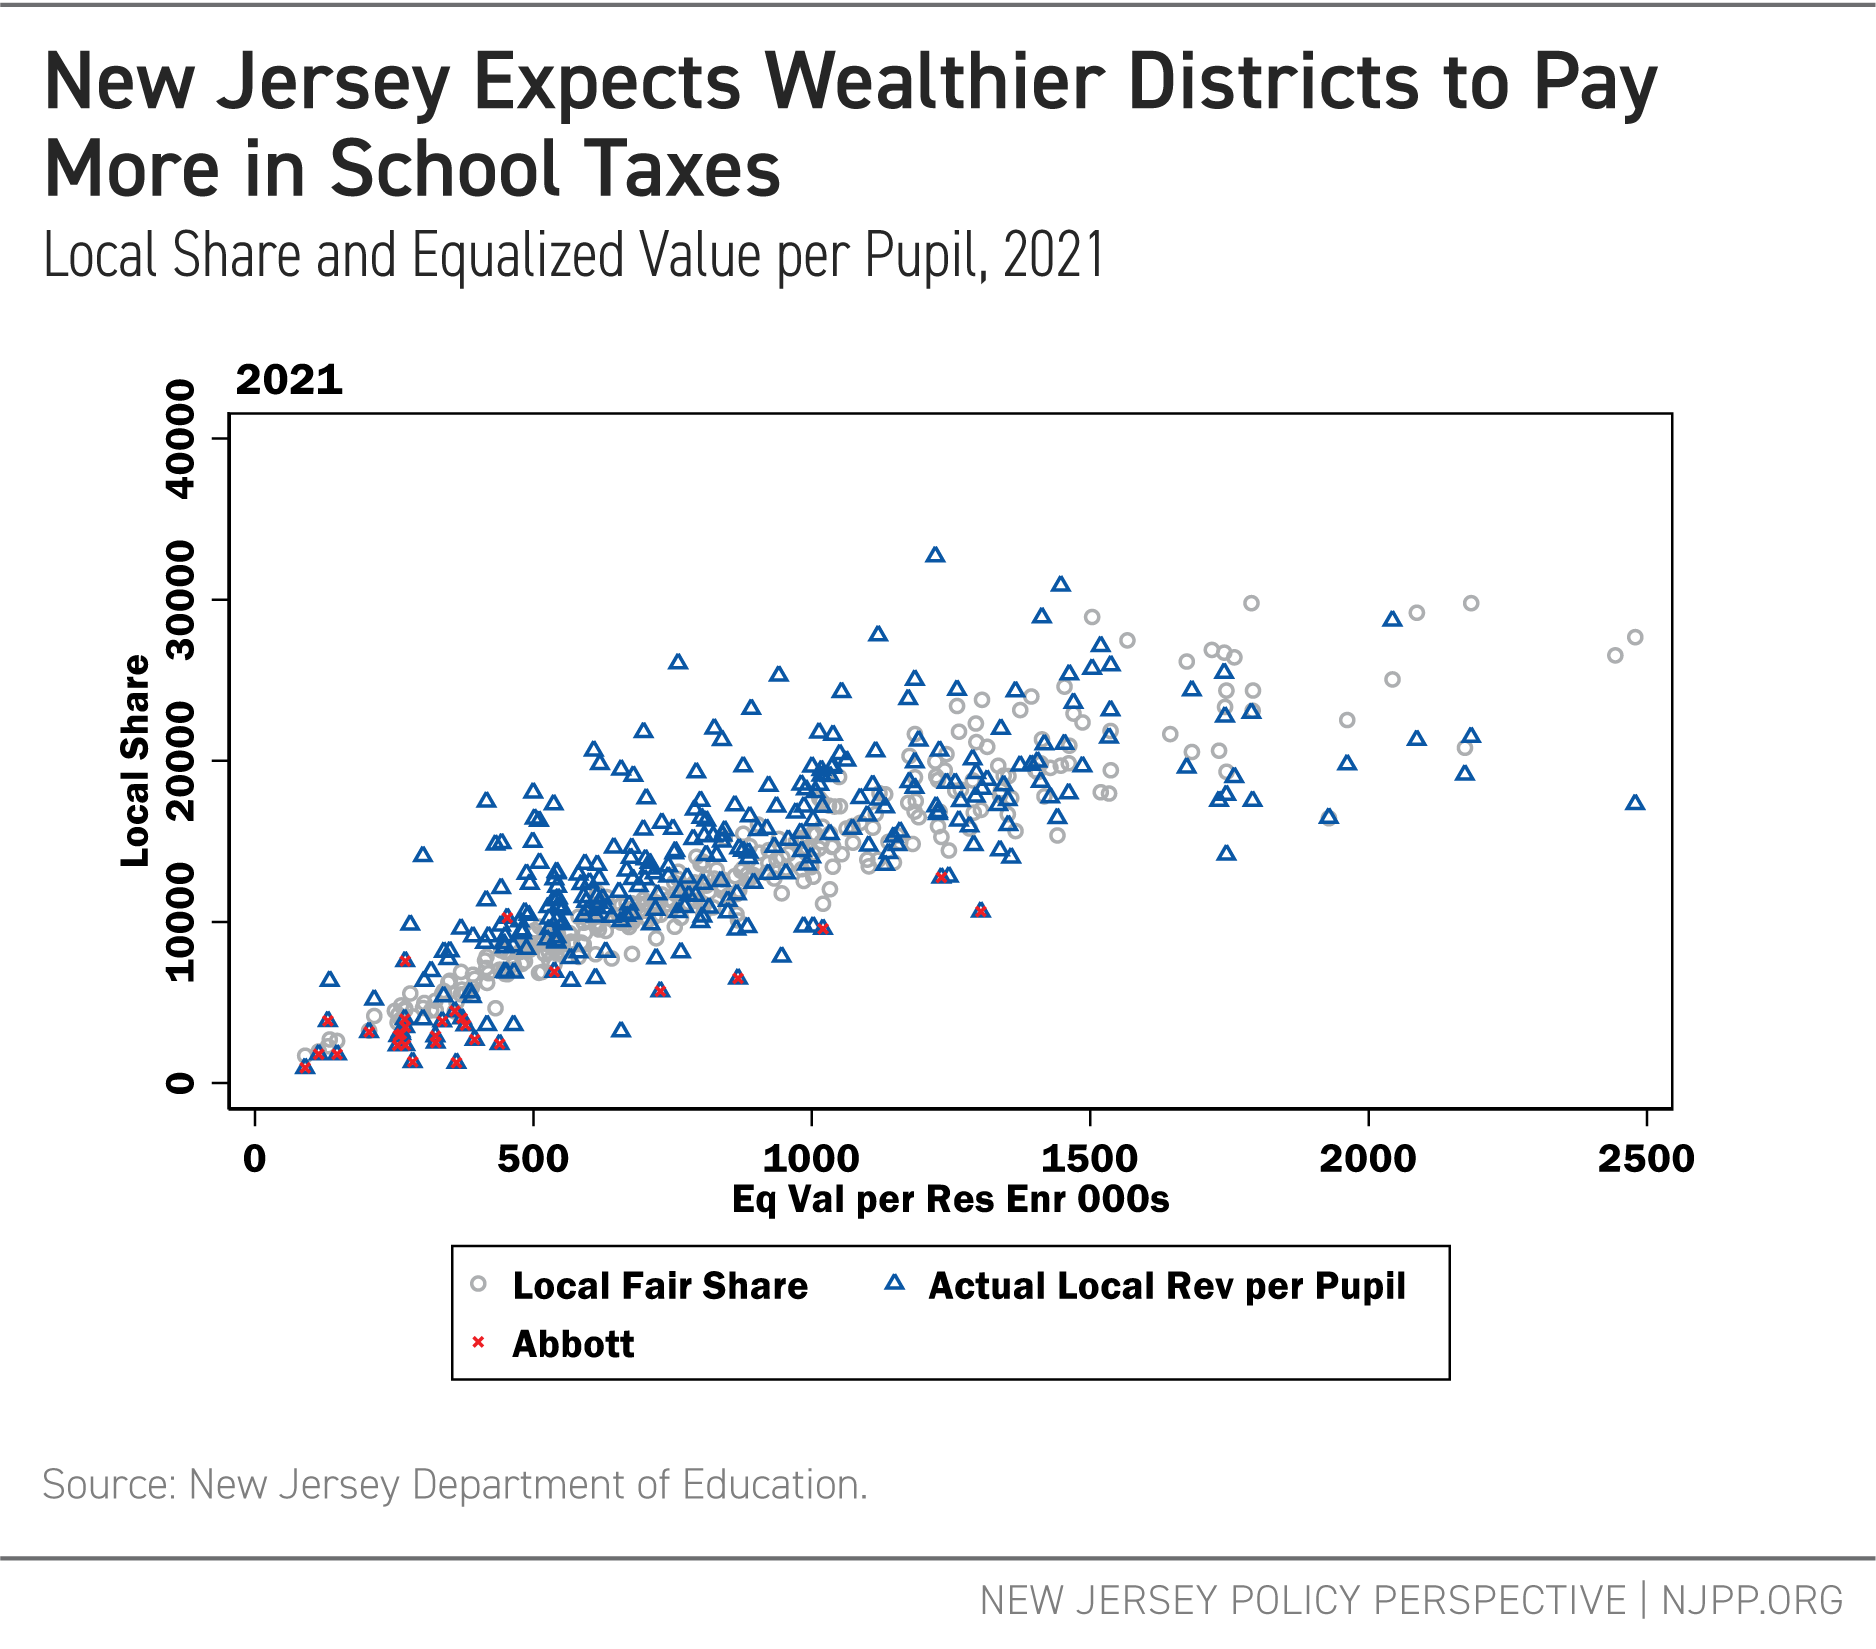
Figure 3
Both property values and income are indicators of a district’s tax capacity; however, they do not always align perfectly. Figure 2 shows that the relationship between local fair share relationship and taxable property wealth is relatively consistent. As expected, districts with higher equalized property values contribute more toward their adequacy targets. Although some districts raise more than their LFS and others raise less, the variation is relatively minimal.
Figure 3, in contrast, shows the same trend but with a less consistent relationship between income and local share. Many districts are expected to raise relatively more revenues than their income levels would suggest, while others are expected to raise less.
Former Abbott districts, shown with a red marker, are typically very low in both taxable property wealth and median household income. Many of these districts continue to raise local revenue below their local fair share. This is due to primarily three reasons: First, funding to Abbott districts before SFRA was allocated without considering for local capacity, which allowed these districts to maintain very low school taxes — a practice that has persisted under the era of SFRA. Second, the local fair share is not a mandatory requirement; districts are not obligated to raise revenues equal to their LFS if they choose not to. Third, legal limits on tax increases prohibited these districts from raising taxes to meet the LFS requirement. Importantly, and as the analyses that follow show, the low school tax rates in these districts do not necessarily mean they have low total tax taxes.
The differences in the relationship between property values and local share versus income and local share highlight an important aspect of New Jersey’s school funding formula: The property and income rates set by SFRA have profound consequences for both school funding and local taxes. Changing one rate relative to the other will change a district’s LFS, even if the underlying tax capacity of that district remains the same. Again, the Education Commissioner set these rates, with no requirement to provide an explanation for how these rates are determined.
School Taxes vs. Total Local Taxes
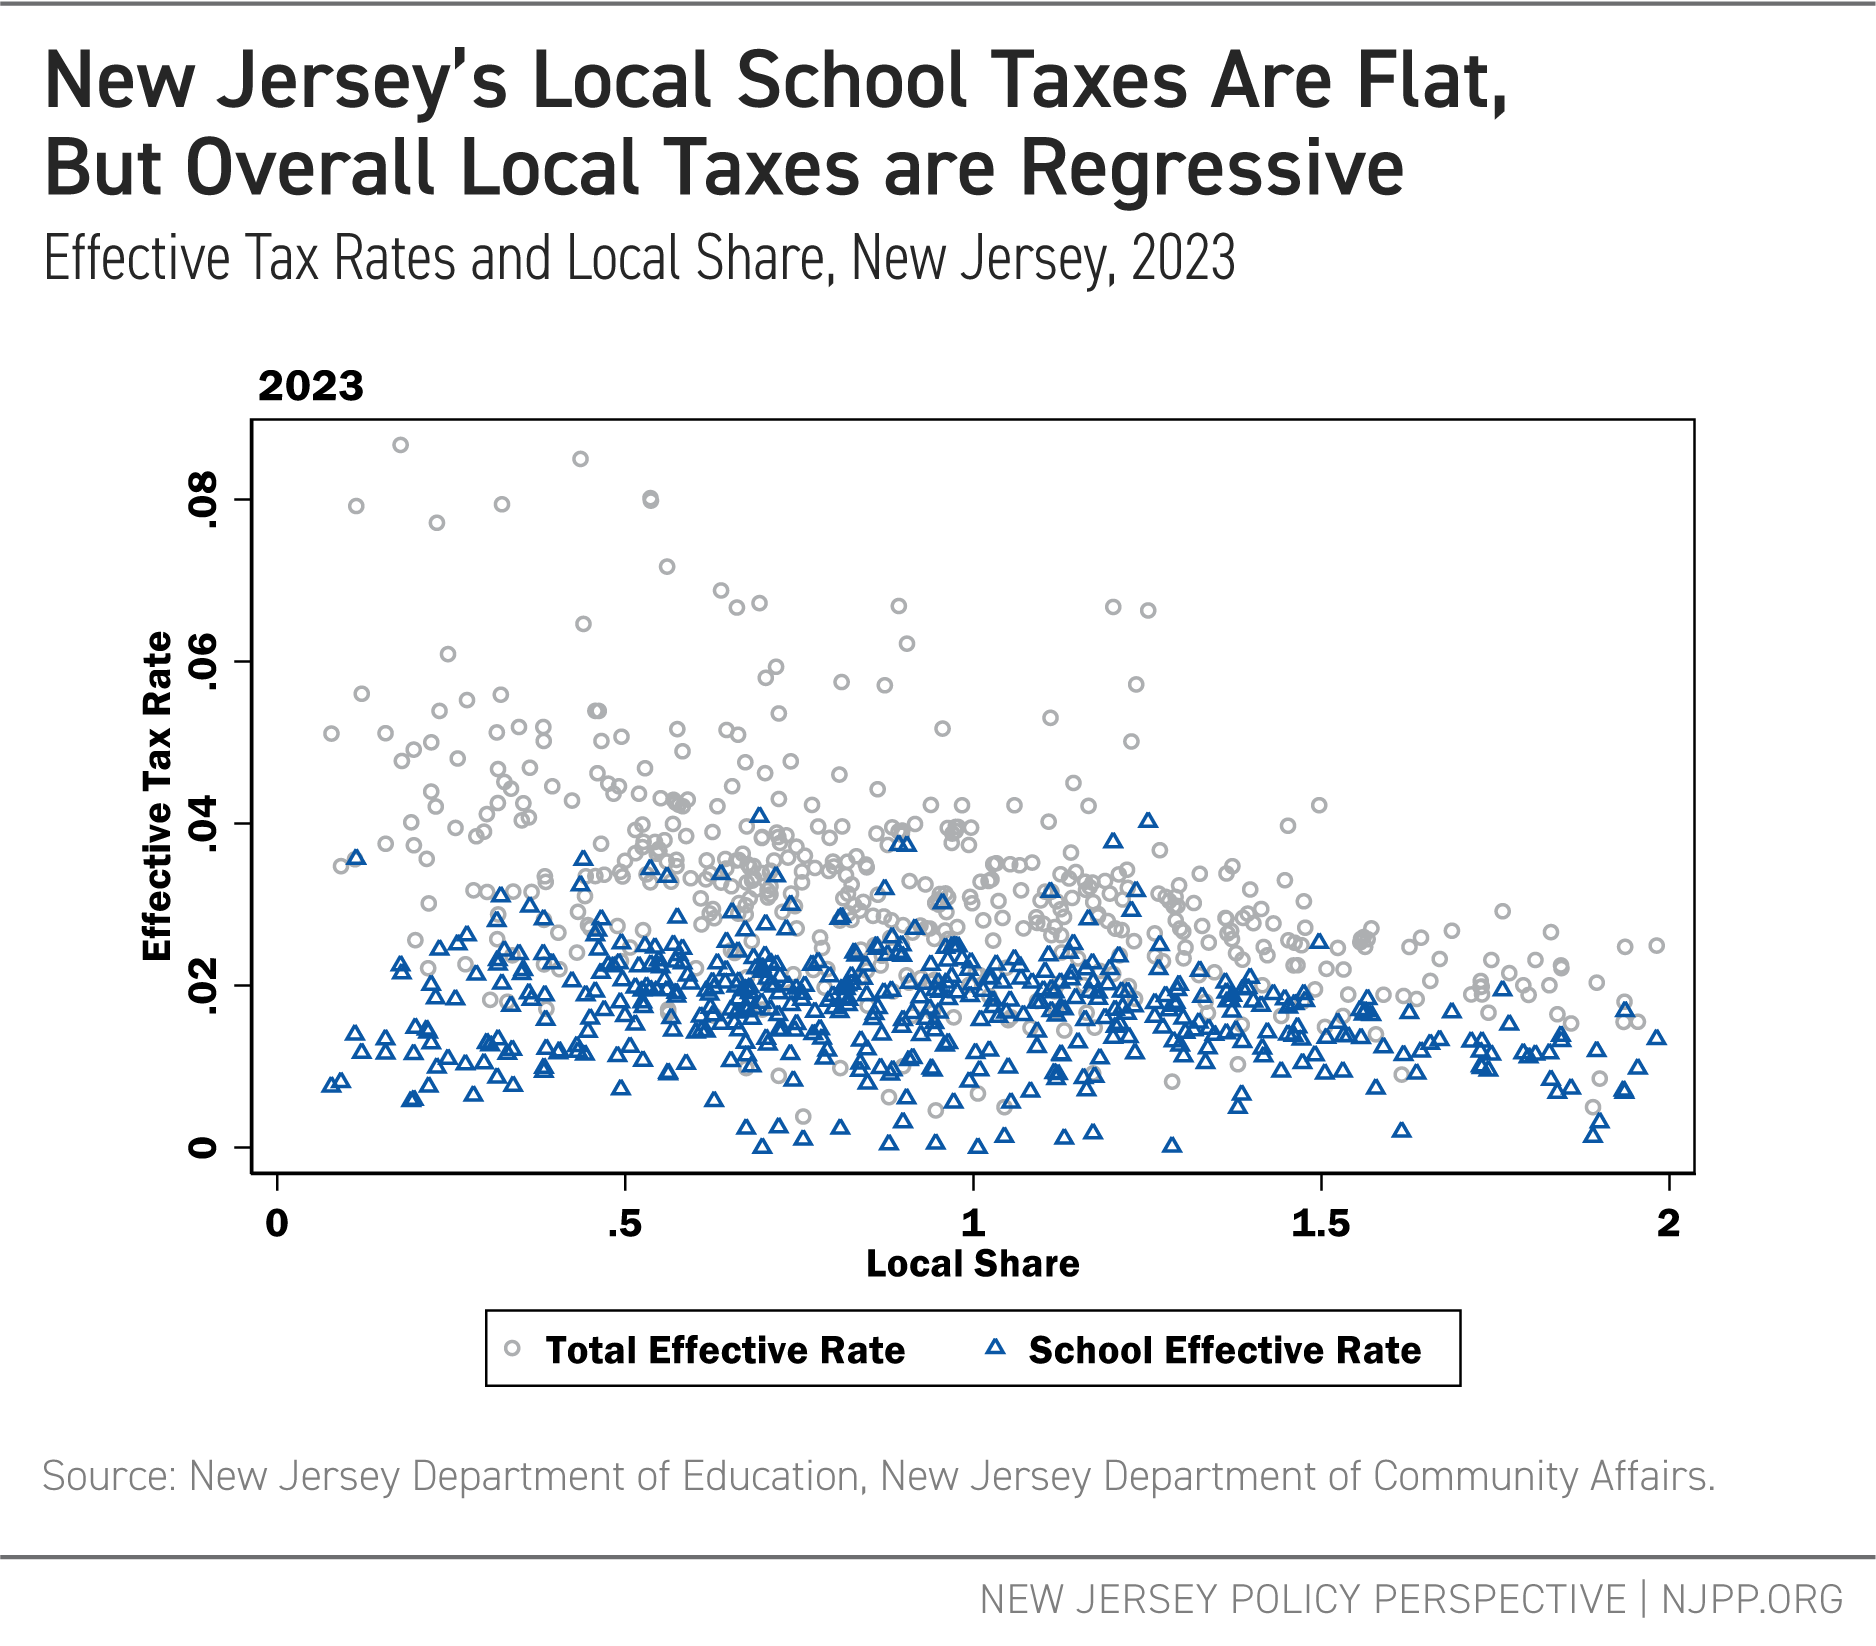
School taxes represent only a portion of a locality’s total local taxes; additional revenues for other public services must also be raised through property taxes. Figure 4 shows effective school and total tax rates in relation to the Local Fair Share ratio for school districts.[vi] From left to right, districts generally range lower to higher in taxable wealth and income, which are key factors in determining local fair share requirements.
Effective school tax rates are relatively flat across the spectrum, with a slight increase in the middle. This suggests that state school aid over time has been effective in maintaining lower local school tax rates in the districts with the lowest wealth and income, thereby keeping those rates relatively equitable compared with wealthier districts. However, the same is not true for total property tax rates. Despite achieving some level of equity in local school rates, total local tax rates remain systematically higher in lower-wealth communities.
Figure 4
Local Tax Equity
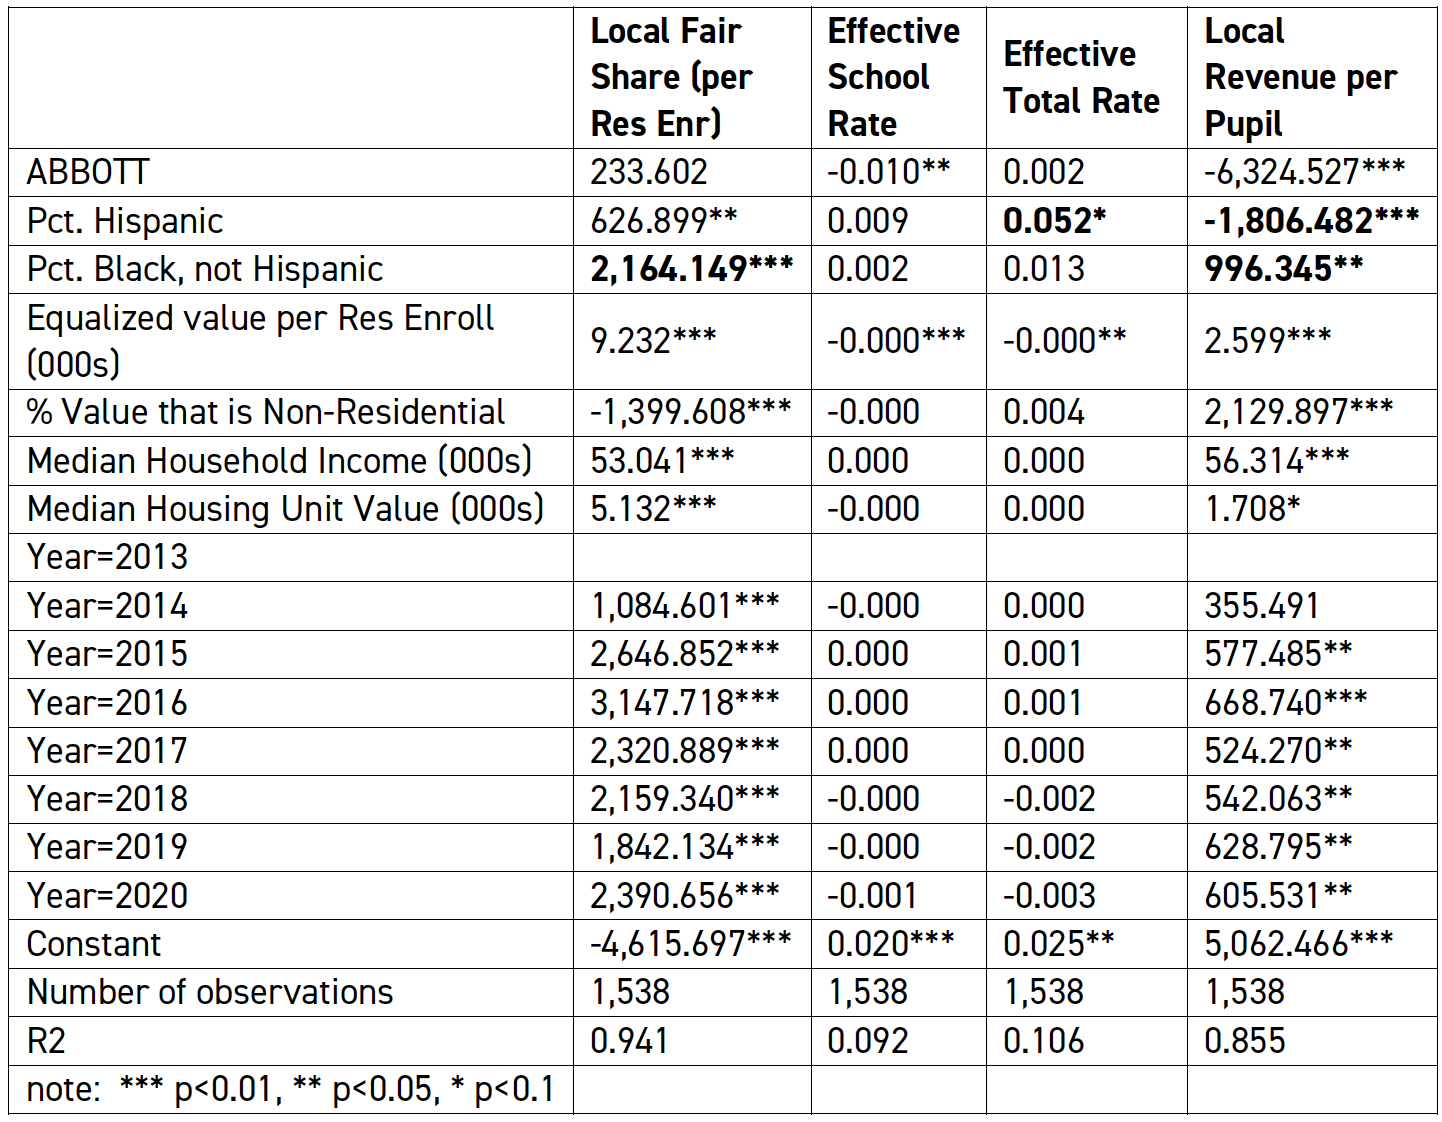
To better understand the effect of SFRA’s formula on tax equity, the authors conducted a series of regression analyses to identify factors associated with differences in (a) local fair share, (b) local revenue per pupil, (c) school tax rates, and (d) total tax rates. The full models, detailed in Appendix E, enable us to isolate the impacts of different district characteristics on tax rates while controlling for other variables. We included measures of taxable wealth per pupil, housing values, and median household income, analyzing data from 2013 to 2020. As expected, local shares and local revenues are higher in higher-income and higher-taxable wealth districts.
Derived from these regression models, Figure 5 focuses on factors associated with differences in local revenue. Former Abbott districts have local fair share expectations in line with their wealth and income (as controlled for in model); however, they generally raise significantly less local revenue per pupil than similar non-Abbott districts.
Figure 5

Figure 6 provides insight into why Abbott districts raise less revenue: their effective school tax rates are lower than other, similar districts. However, their total local tax rates are roughly equivalent to those of comparable districts. The interplay between school taxes, total taxes, and municipal obligations warrants further study; but for now, it is sufficient to note that total tax rates should be considered in any analysis and reform of the SFRA formula.
Figure 6

The most important — but, given previous work, not unexpected — disparity revealed across the figures is that as Hispanic/Latinx enrollment increases, local revenues decline and local tax rates, particularly total tax rates, increase. Earlier NJPP reports have documented funding gaps in predominantly Hispanic/Latinx districts in New Jersey;[vii] the current models here provide additional evidence of this disturbing reality. These models also indicate that even the local fair share calculation disproportionately burdens these communities, holding other factors constant. This disparity is even more pronounced in Black communities, which face higher local share expectations, all else being equal. But it is Hispanic/Latinx communities that face significantly higher local taxation as a result. Reforms of SFRA must include changes that eliminate these persistent and inequitable tax effects on communities of color.
Another key issue involves taxable property wealth that is non-residential (commercial, industrial, etc.). In communities with proportionately more non-residential property, LFS is lower, yet the actual revenues raised are higher. In other words, school districts with more non-residential property raise more in local revenues, even though they are expected to raise less.
The easiest tax for which to gain political support is the tax on someone else. Property taxes on non-residential properties are partially borne by non-local residents: outsiders who don’t access the local schools still pay some school taxes when they conduct business within the district. However, this non-residential taxable wealth is unevenly distributed across taxing jurisdictions, often causing significant revenue-raising disparities. The value of those properties does not depend exclusively on the demand for their products or services within the same jurisdiction (think, for example, Paramus or Cherry Hill shopping areas). As such, school finance experts have long argued that such properties could or should be taxed regionally or statewide to balance these local tax distortions and provide more equitable statewide revenue distribution according to costs and needs across districts.[viii]
Conclusions and Recommendations
New Jersey’s School Funding Reform Act (SFRA) is due for a revision: it is not providing enough funding to the districts that need it the most, and its method for calculating local fair share should be improved.
Regarding the setting of adequacy targets, this report recommends:
- Strictly adhere to the schedule of updating the formula every three years, using cost-modeling methods to guide any changes.
- Implement data-driven, cost-modeling approaches based on current standards to determine base costs and weights in SFRA. This will increase the weights for poverty in SFRA’s formula, which is necessary for high-poverty districts to receive the revenues needed to meet New Jersey’s current, more rigorous standards. (See Appendix B for more)
Regarding the revenue side of SFRA, this report recommends the following:
- The New Jersey Department of Education (NJDOE) should develop a set of indicators to monitor the equity of school property taxes, total property taxes, and overall tax burdens annually.
- NJDOE should then use these indicators to evaluate tax disparities related to race, ethnicity, and income of taxpayers and students.
- Using these indicators, the state should reassess the property and income rates in the Local Fair Share (LFS) part of the SFRA formula, aiming to establish rates that promote goals of tax equity and progressivity.
- Once Local Fair Share amounts are set to reasonable and equitable levels that are not an undue burden on local taxpayers, the state should require school districts that are under SFRA adequacy to raise their full LFS through local taxes. Districts should provide their LFS with the understanding that the state will fully fund SFRA to meet current outcome goals. Again, total local taxes should be accounted for when calculating LFS. If districts need to raise local taxes rates to meet their LFS, those rates should be phased in over time to avoid any shocks to taxpayers.
- Regionalize industrial and commercial property taxes to distribute their revenues more equitably and correct racially and ethnically disparate local share requirements.
Appendices
Appendix A: An Update On New Jersey School Funding Equity
When New Jersey adopted the School Funding Reform Act (SFRA) in 2008, the state already had one of the country’s most progressive state school funding systems, targeting substantial additional state funding to the districts, schools, and children that needed those resources most. However, the distribution of state aid was determined largely by decades of litigation (known as the Abbott rulings), resulting in state aid targeted explicitly to only those districts that brought the litigation. While this drove a significant amount of revenue to the school districts that needed it the most, state aid — and its influence on local property taxation — was still uneven: some districts needed more financial help to fund their schools and keep their local taxes equitable.
Unfortunately, the adoption of SFRA was met with the onset of the Great Recession and Governor Chris Christie’s subsequent decision to cut state aid to schools. It is not an overstatement to say that 2008 represents the beginning of the collapse of school funding equity in New Jersey. While recent years have seen some improvement, the consequences of this collapse still affect many New Jersey school children and taxpayers.
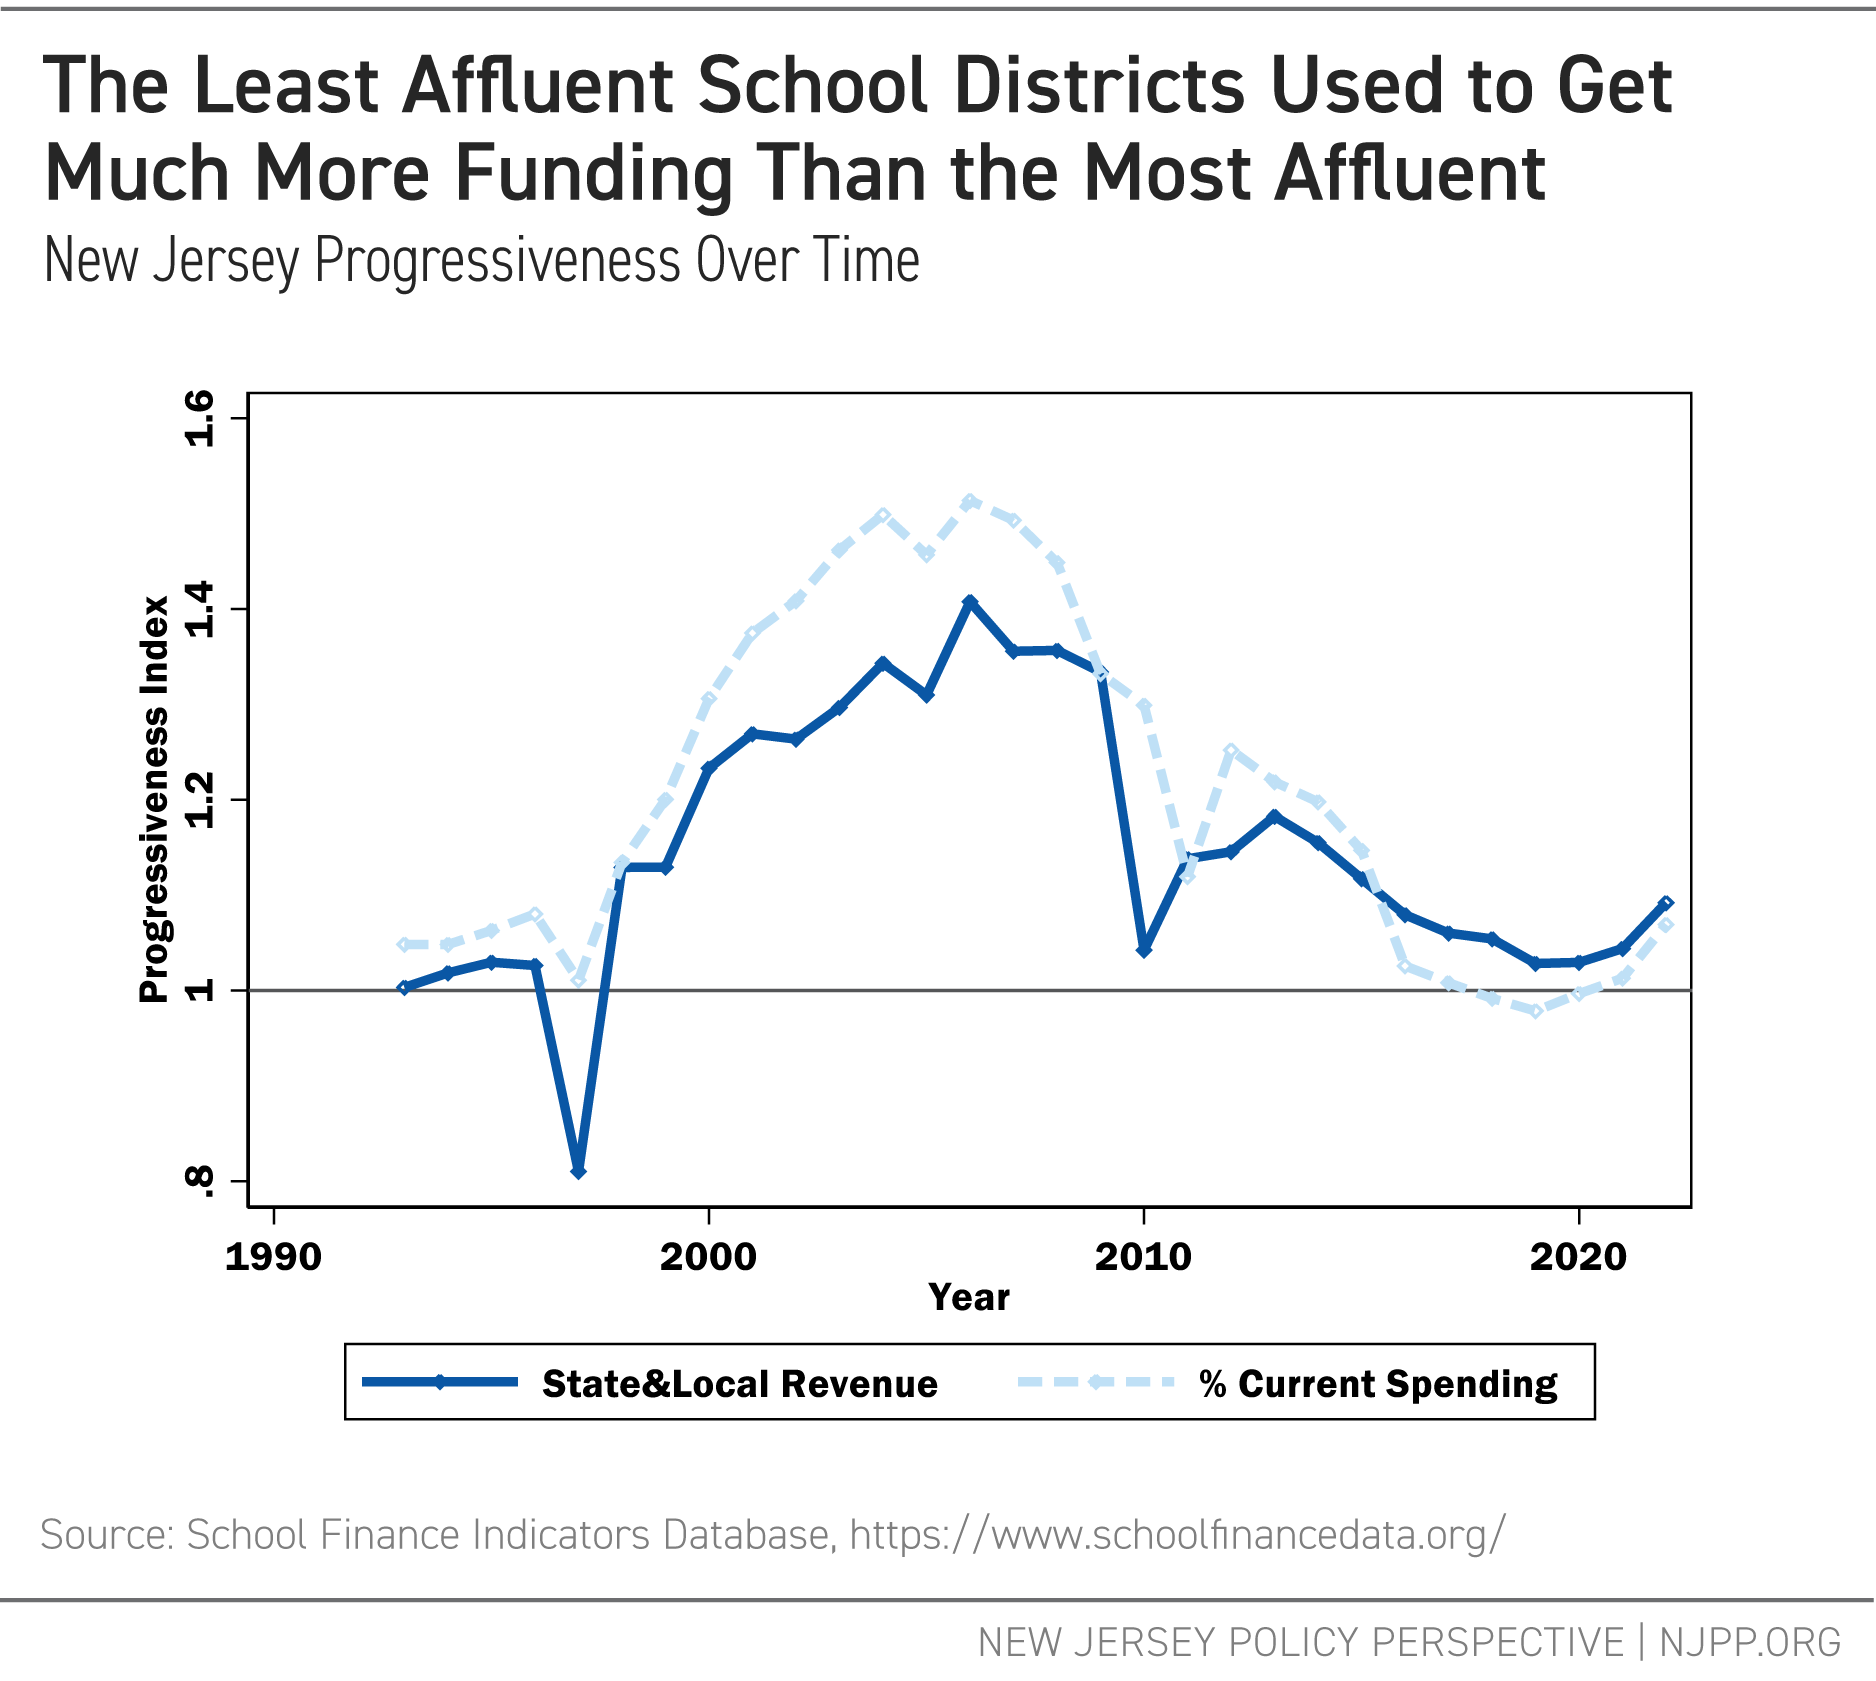
Figure 7 shows how the recession and Christie’s cuts impeded New Jersey’s effort to equitably fund its school districts. In the early to mid-1990s, the ratio of current spending per pupil to state and local revenue per pupil were roughly the same (1:1, or index of 1.0) for districts that had very low child poverty rates compared to those that had very high child poverty rates. This was despite the widely known fact that children in poverty need more school funding to ensure equal educational opportunities.[ix] However, throughout the 2000’s, the Abbott rulings forced the state to increase aid to many high-poverty districts, leading to more equitable funding. This trend reversed during the Christie Administration, and by 2019, New Jersey was back to where it had been in the early 1990s, with school spending becoming essentially flat once again. In recent years, the state’s movement towards fully funding SFRA has at least prevented further erosion; however, there has only been modest progress toward restoring the level of progressive school funding seen in 2008.
Figure 7
It’s important to recognize that the erosion of progressivity in New Jersey’s school funding is not solely the result of underfunding SFRA. Under the law, The New Jersey Department of Education is required to prepare an Educational Adequacy Report (EAR) every three years. The EAR is supposed to recalibrate the SFRA formula, adjusting its components to set both appropriate adequacy targets and fair levels of local revenues for schools. However, since the passage of SFRA, the department has either shirked this responsibility (under the Christie administration) or recalibrated the formula without considering factors such as the state’s increasing expectations for student outcomes.[x]
Appendix B: Setting Adequacy Targets: An Update
Previous NJPP reports about SFRA focused largely on how to target “adequacy,” which refers to the amount needed for a school district to provide a constitutionally mandated education that allows students to meet the state’s increasingly rigorous standards.[xi] Here, this report gives an update of this work, using current data to calculate the latest version of these adequacy targets. This analysis finds, once again, that school districts with the highest rates of poverty are not spending enough to meet New Jersey’s new, more rigorous standards.
As described in earlier NJPP reports, SFRA accounts for different student needs through a system where “base amounts” and “weights” are set by the state, resulting in an adequacy target for every school district.[xii] The base amount is the amount of revenue per student a school district needs to educate an elementary school student who is not economically disadvantaged and is not an English Language Learner (ELL). When a district counts its students, each student is “weighted:” students who are economically disadvantaged, ELLs, or in upper grades add more to the weighted student count. That count is multiplied by the base to set the district’s adequacy target. While there are other factors accounted for in SFRA, the base and the weights are at the heart of the law’s adequacy formula.
For SFRA to validly determine how much each New Jersey school district needs, its base amount and weights need to be set correctly. The base weight must reflect the true cost of educating an elementary student so they can achieve the goals the state has set. Likewise, the weights must reflect the additional cost of educating an economically disadvantaged, ELL, or upper-grade student. If the base and weights are wrong, a district will not have the revenues it needs to be able to achieve its outcome goals. The Education Adequacy Report (EAR), which is supposed to update the SFRA base and weights every three years, is, therefore, critically important: it must set the base and weights correctly for schools to receive the funding to be successful.
As noted in previous work, New Jersey has raised its outcome goals for students over the past two decades, but has failed to change its school funding formula to align with these new goals.[xiii] To measure the extent of the problem, previous reports from NJPP have used the National Education Cost Model (NECM).[xiv] Grounded in actual data and time-tested empirical methods, the NECM gives a valid, reasonable estimate of the cost of students achieving, on average, a particular educational outcome. What follows here are the latest NECM cost estimates; see the table at the end of this appendix for model specifications and estimates.
Figure 8 shows the average current spending, SFRA adequacy budget, and NECM-predicted costs by school district poverty quintile from lowest poverty to highest. Regarding existing per pupil spending (the grey bars), the average is just over $20,000, regardless of whether a district is very low in child poverty concentration or much higher. Like in the early 1990s (see Figure 7 above), spending per pupil is currently flat in New Jersey with respect to poverty, despite the presence of a poverty weighting factor in SFRA.
The lighter blue bars represent what SFRA would provide as an “adequacy budget” for each group. Adequacy budgets for low-poverty districts are just over $15,000 per pupil; for high-poverty districts, just over $20,000 per pupil. SFRA is, therefore, somewhat progressive; however, that progressivity is offset by local choices in affluent districts to spend above that level. The fact that low-poverty districts choose to spend much more than their SFRA adequacy targets suggests that those targets are well below what New Jersey residents want for the education of their communities’ children.
Figure 8
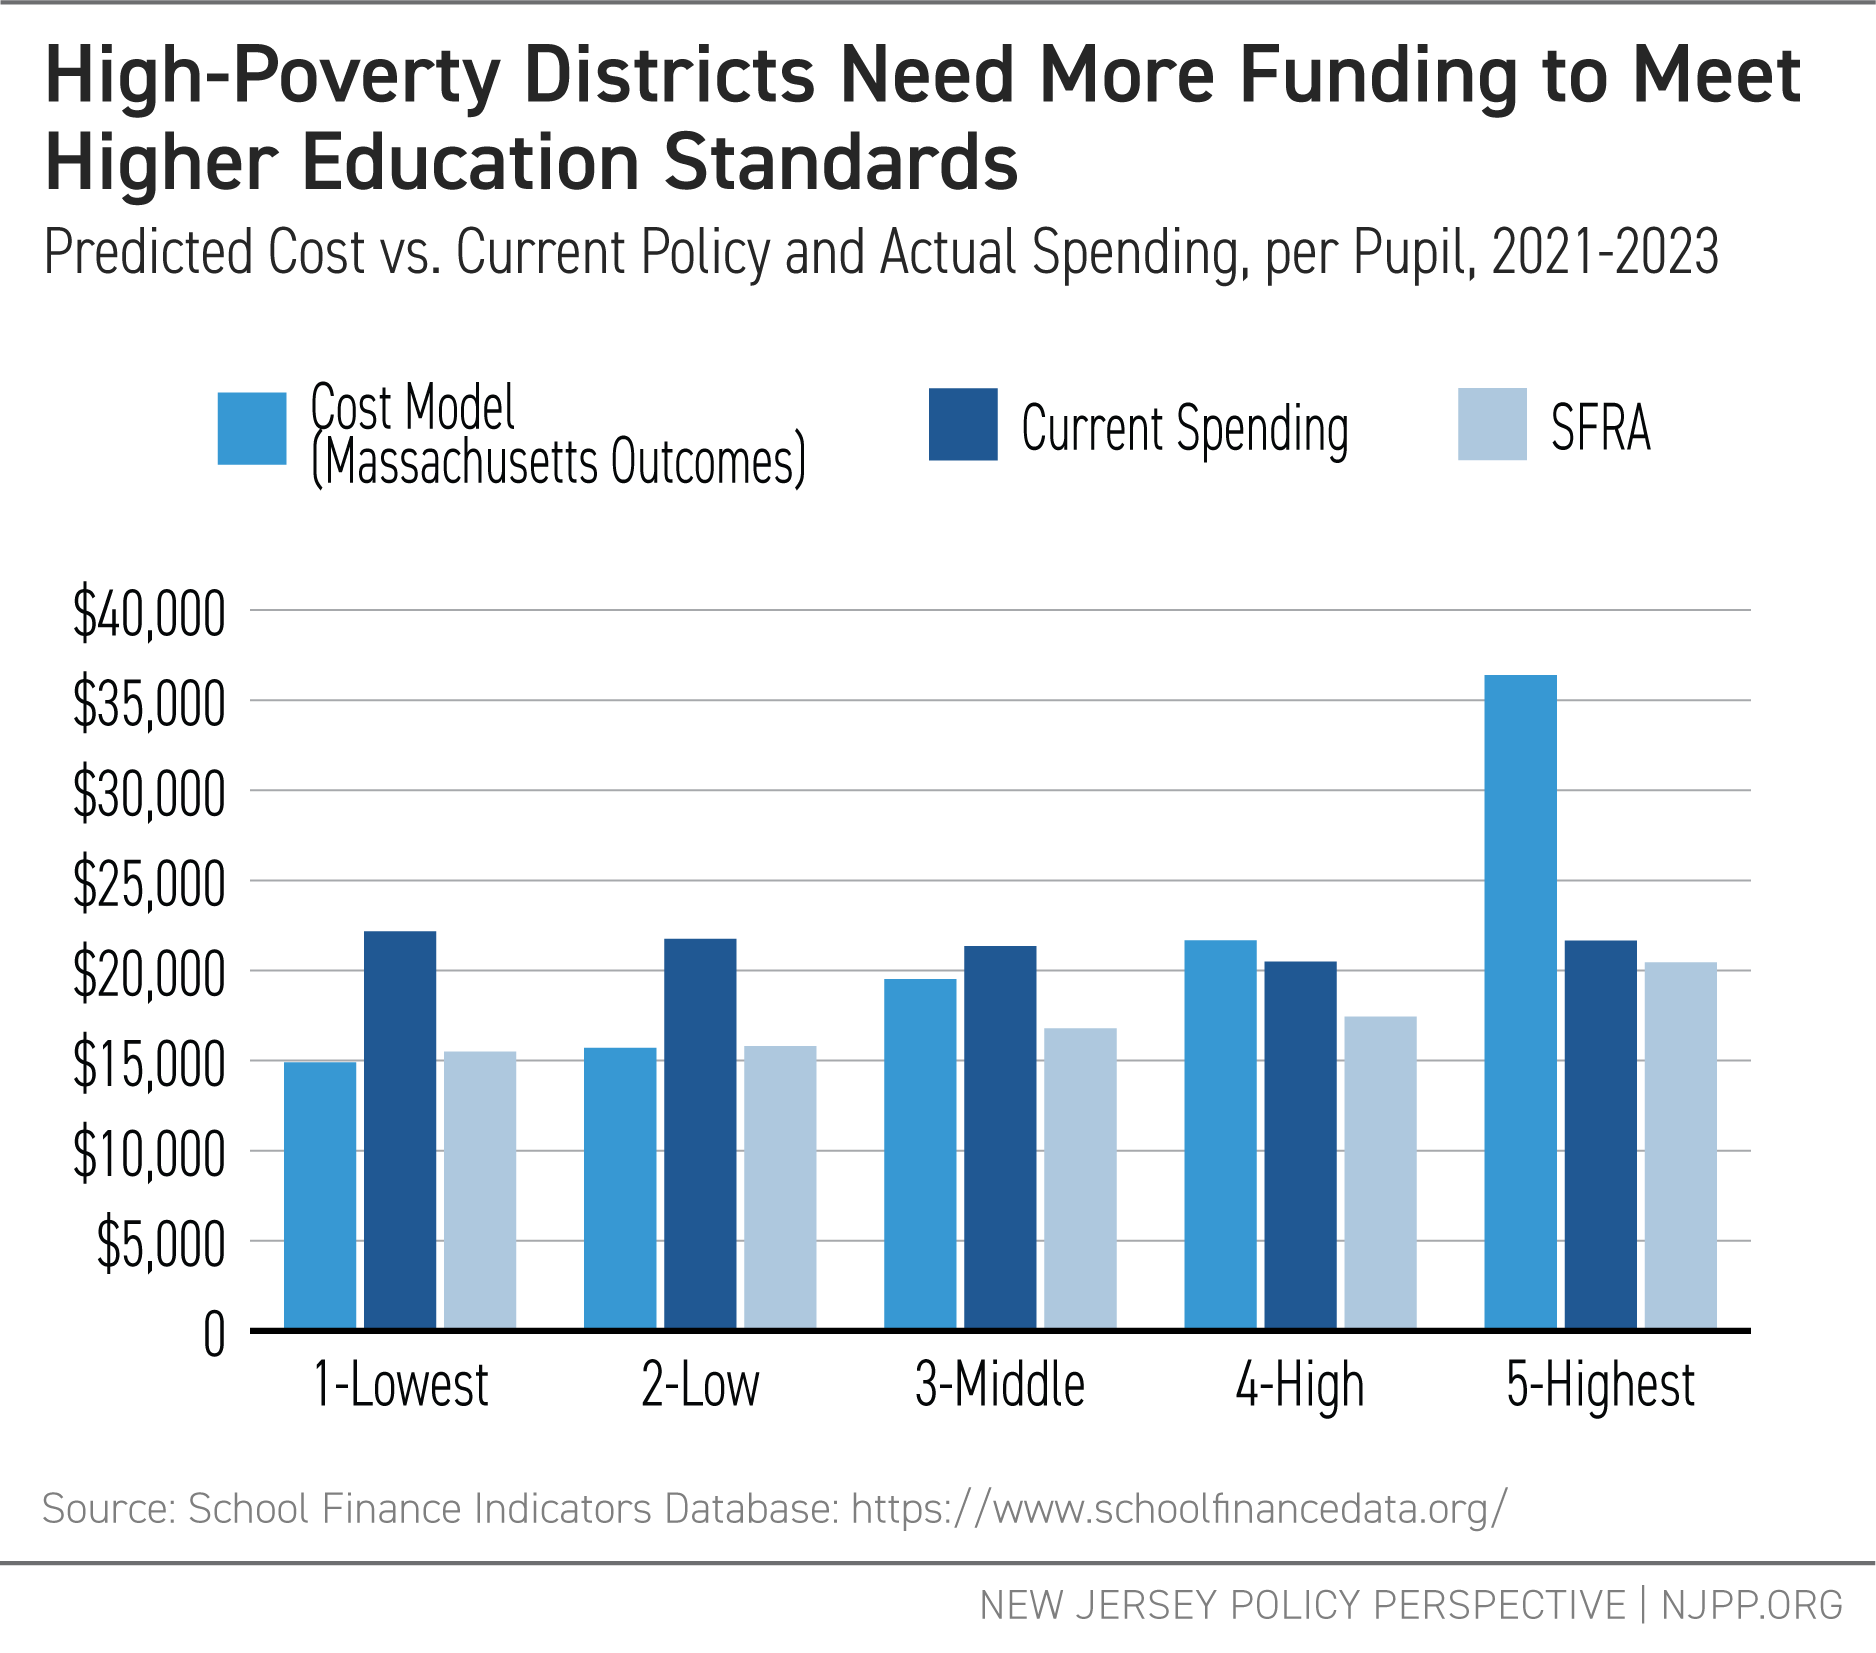
The medium blue bars estimate the per pupil cost — predicted from the NECM — to achieve reading and math outcomes equivalent to the Massachusetts average, which is slightly higher than the New Jersey average, and, as discussed in our previous reports, on track with college and career readiness.[xv] New Jersey school districts with low to moderate levels of poverty currently spend at or above what they’d need to achieve these outcomes (and most of these districts achieve these outcomes). SFRA, however, provides sufficient adequacy budgets only for the state’s more affluent districts.
In contrast, the highest poverty districts continue to show a large gap between what the NECM says they should spend and what they actually do spend. Worse, the gap between what NECM says districts should spend and their SFRA targets is even larger; in other words, SFRA adequacy targets for high-poverty districts are well below where they should be to meet the goals the state has set. As reported in the past, these analyses suggest the poverty weights in SFRA are too low to meet the state’s current, more rigorous standards.[xvi] Properly recalibrating SFRA will require bringing these weights up, using current data and modern costing methods to set valid targets.
National Education Cost Model vs. Current Spending and SFRA Targets
Appendix C: Sources of Revenues
In New Jersey, as in many other states, state and local revenues are collected through different types of taxes. The table below lays out the features of the three main revenue sources for the state: property taxes, sales taxes, and income taxes.
Property taxes are collected primarily at the local level, although sometimes not directly by the school district but by the parent government (city or town), which in turn allocates the revenue to local schools. As illustrated above, property taxes are highly inequitable across localities, meaning that affluent communities often have lower tax rates than those with less property wealth. However, property taxes are also relatively stable in terms of the revenue they generate, making them particularly attractive to school districts because they provide consistent funding regardless of economic fluctuations.
While property taxes can be regressive, they tend to be less so, on average, than sales taxes. Sales taxes are primarily state source taxes but increasingly include local option sales taxes, which in some states make up a substantial share of local revenues. Sales tax revenues are moderately volatile but less so than income tax revenues.
Table 4 summarizes the advantages and disadvantages of different sources of tax revenues. Because each type of tax has its own trade-offs between property, sales, and income taxes, state tax systems tend to rely on some combination of all three.
Table 4: The Pros and Cons of Different Tax Revenue Sources
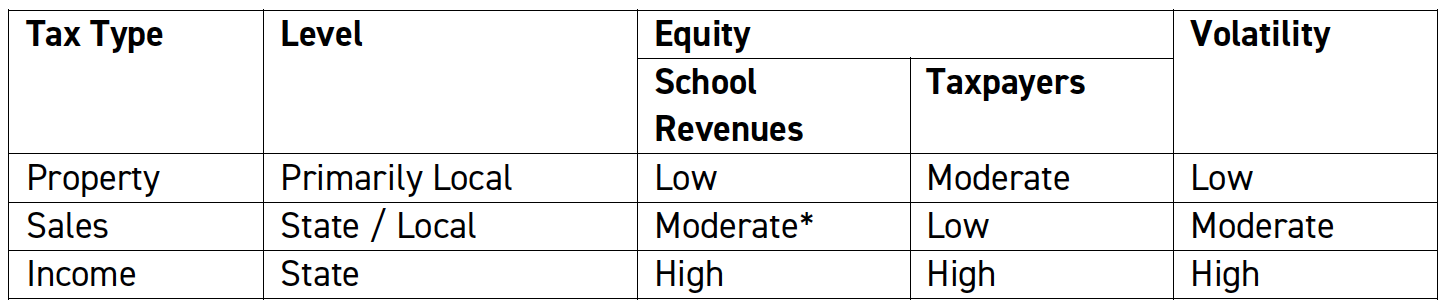
*Increased use of Local Option Sales taxes
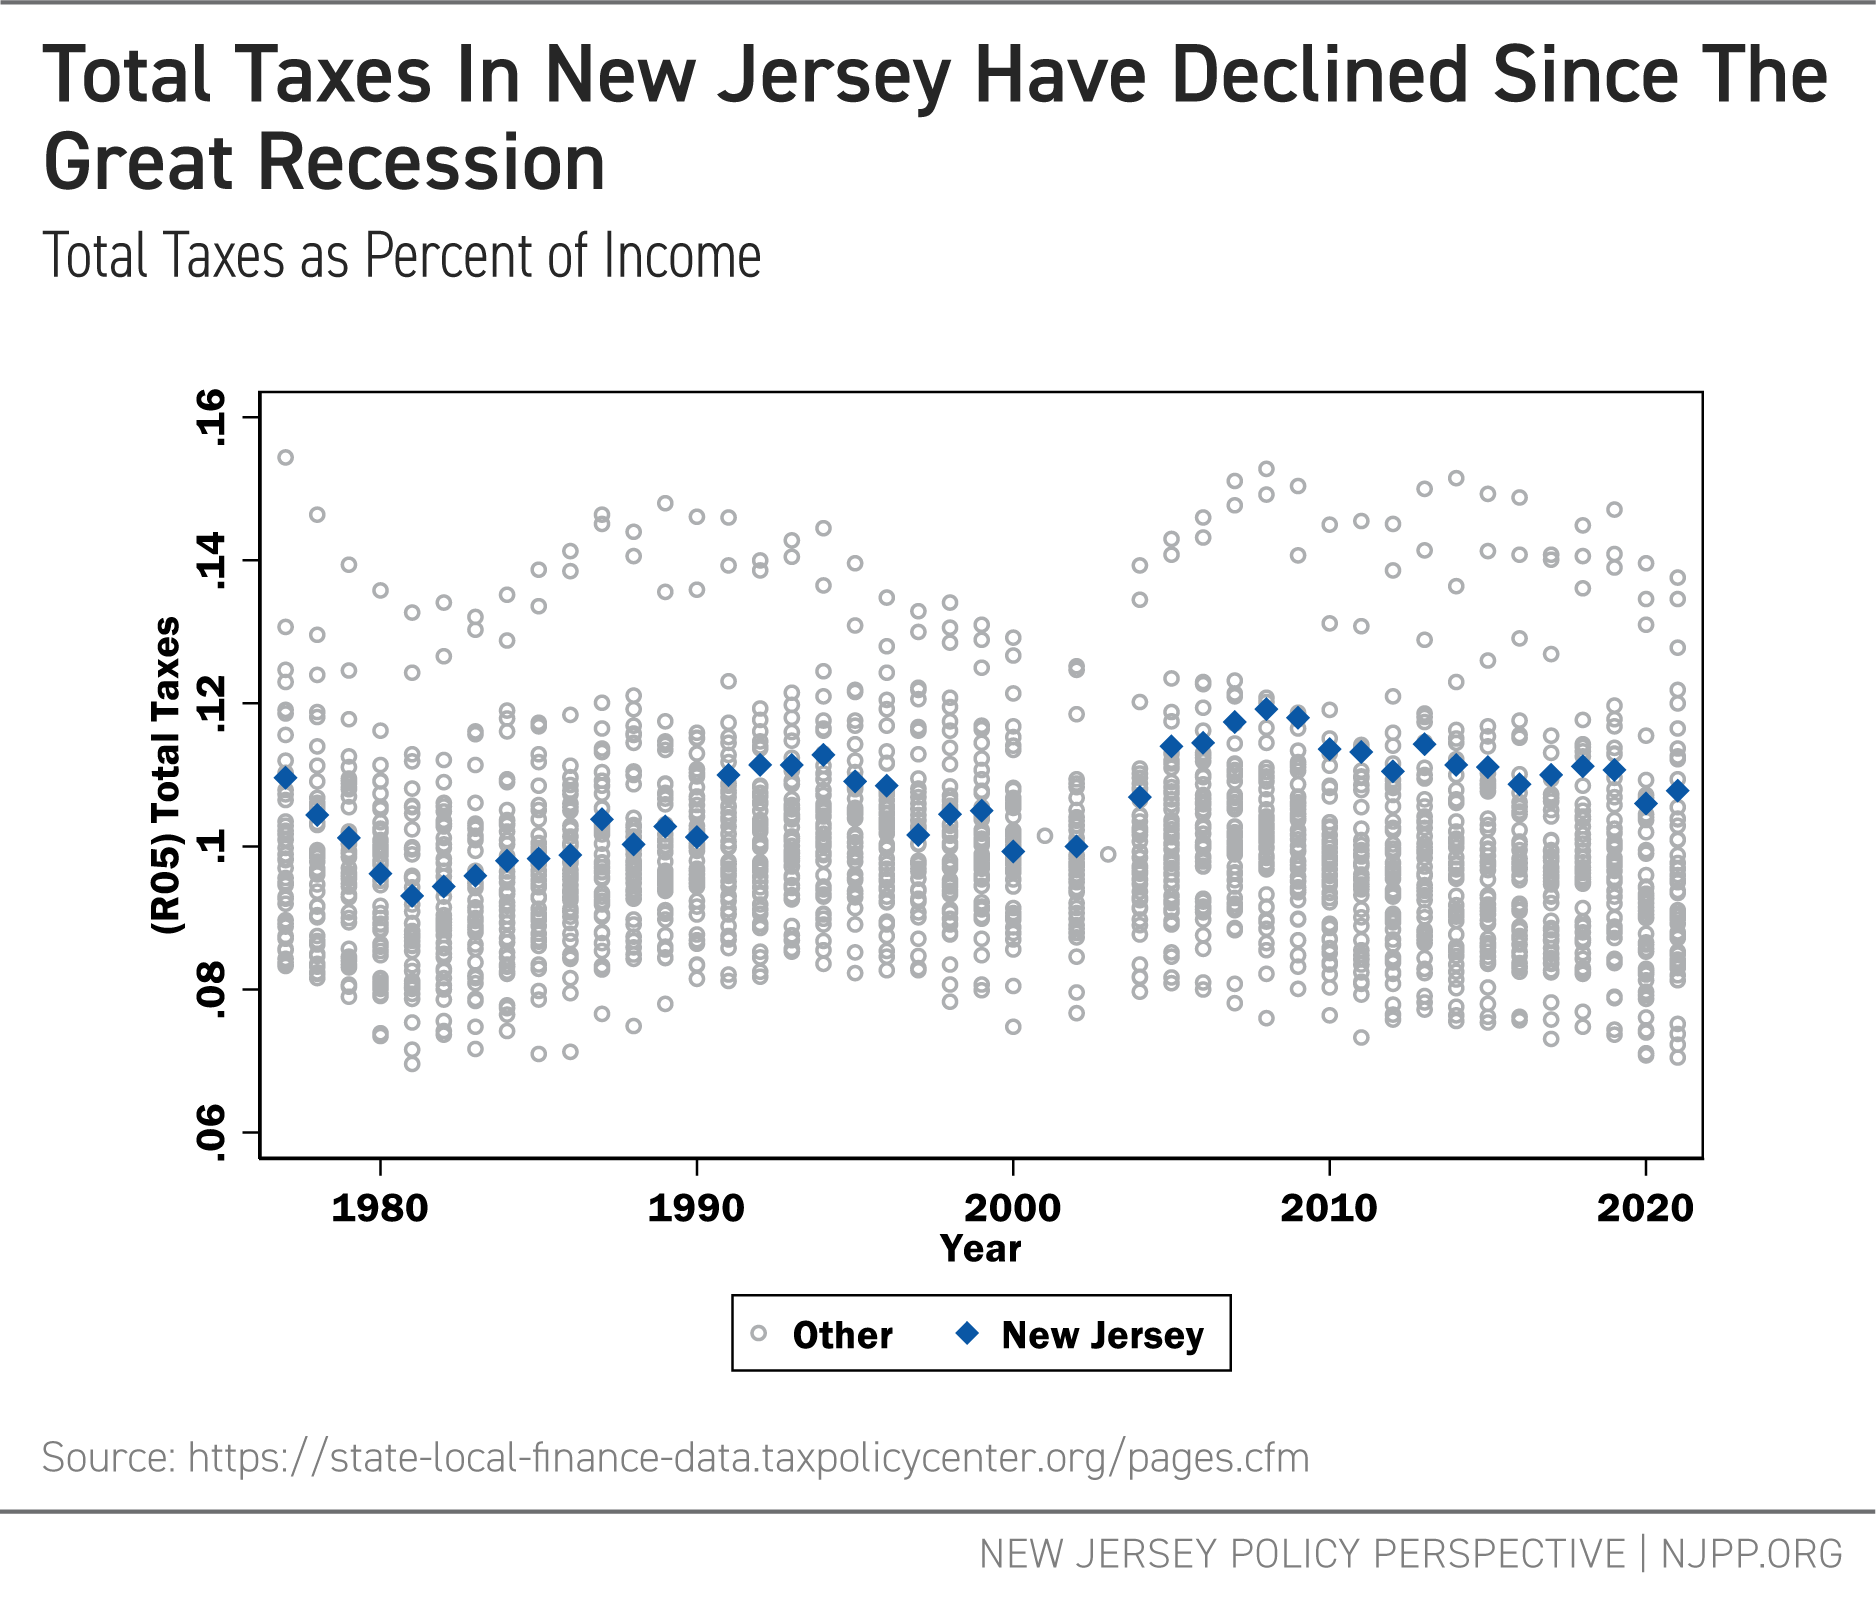
Appendix D: New Jersey’s Tax Effort
School finance researchers often describe the level of state and local funding in terms of effort: the percentage of a state’ or locality’s tax capacity that is spent on schooling. When calculating a state’s effort, tax capacity is often measured as the total personal income for the state; the percentage of that income spent on schools is its effort.
Figure 9 shows the effort of all 50 states to fund schools from 1997 to 2021 with New Jersey highlighted. From 2000 to 2005, New Jersey dramatically increased its effort, coinciding with the targeting of substantial funding to higher-need districts following the Abbott decisions. But like nearly every other state, New Jersey decreased its effort toward funding K-12 education following the Great Recession of 2008—2009. Had New Jersey simply maintained its effort level from 2006 — in other words, made the policy choice to continue spending the same percentage of its economy on K-12 schooling each year — revenue could have been up to 14.3% higher, on average, from 2016 to 2021.[xvii]
Figure 9
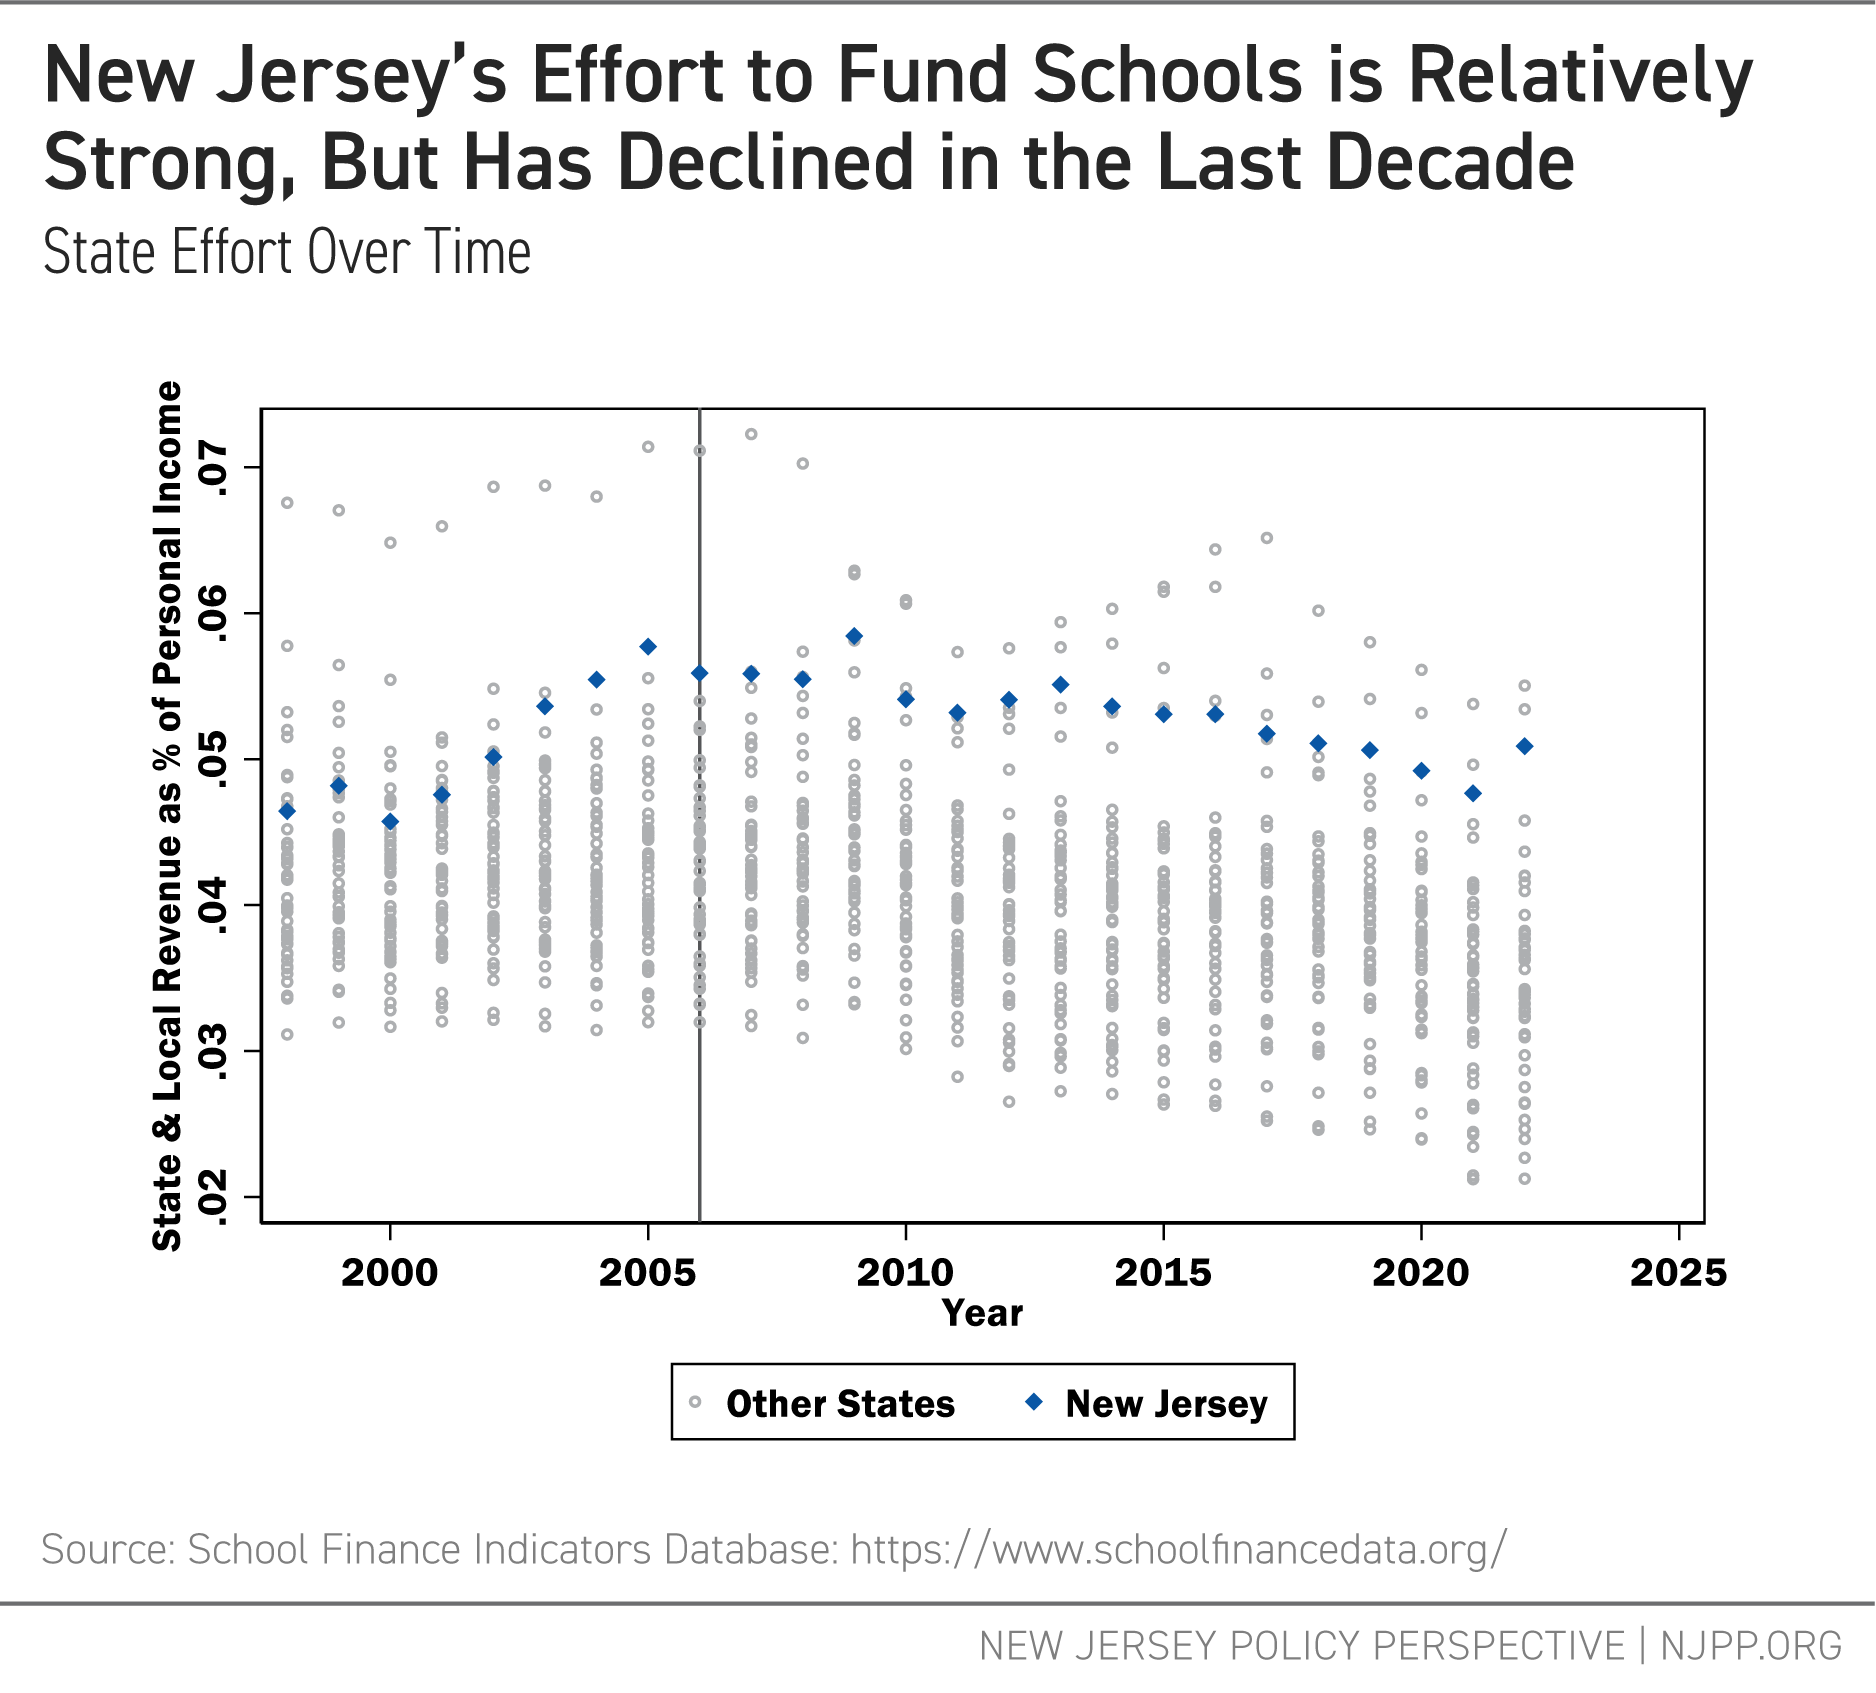
While Figure 9 shows K-12 education revenues as a share of income, Figure 10, below, compares total state and local taxes as a share of income for New Jersey among other states. Although taxes in New Jersey are higher than in many other states, the state is not an extreme outlier, with several other states collecting higher amounts proportionally. Notably, New Jersey ranks somewhat lower on total state and local taxes as a share of income than it does on K-12 effort. In addition, and like K-12 effort, total taxes as a share of income have declined since their pre-recession peak. These analyses suggest that while New Jersey makes a relatively strong effort to fund its public schools, there remains room for improvement.
Figure 10
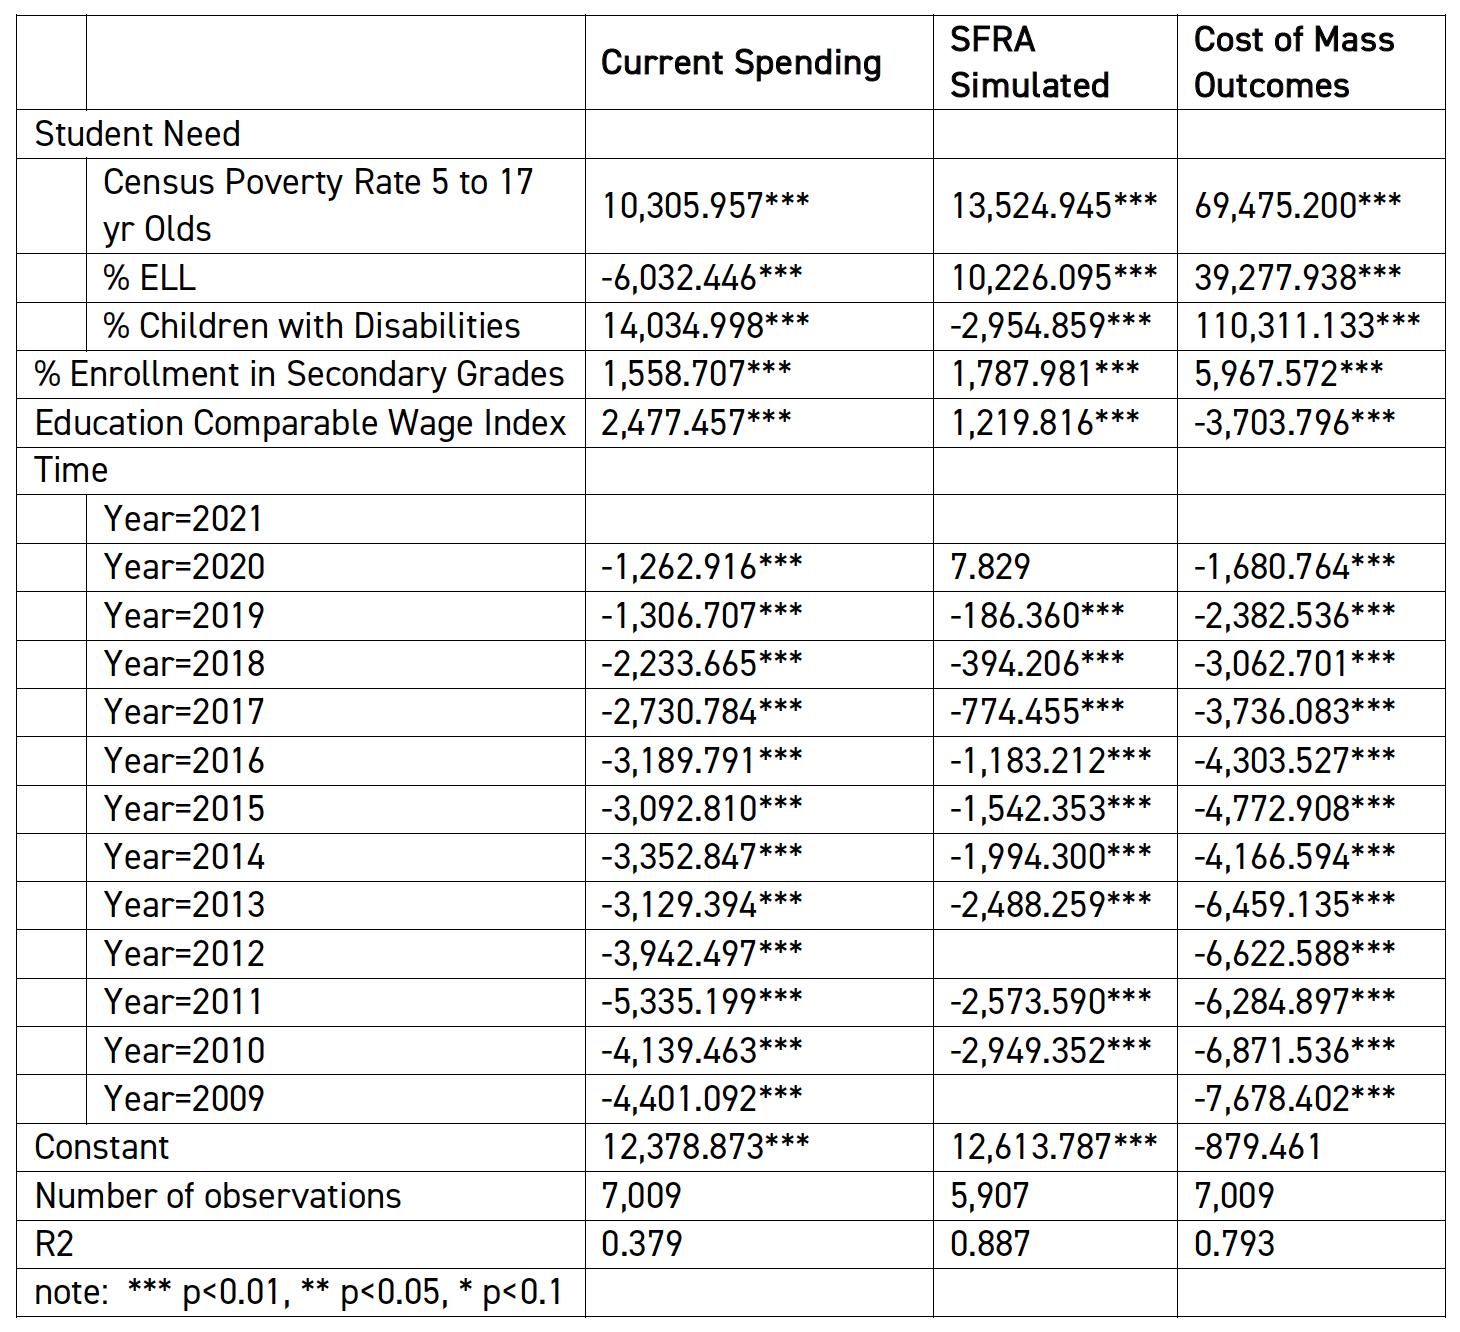
Appendix E: Local Fair Share, Effective Tax Rates (School and Total), and Local Revenue per pupil Models
End Notes
[i] Duncombe, W. D., & Yinger, J. (2005). How much more does a disadvantaged student cost? Economics of Education Review, 24(5), 513–532.
Baker, B. D., Weber, M., & Srikanth, A. (2021). Informing Federal School Finance Policy with Empirical Evidence. Journal of Education Finance, 47(1), 1–25.
Jackson, C. K., & Mackevicius, C. L. (2024). What Impacts Can We Expect from School Spending Policy? Evidence from Evaluations in the United States. American Economic Journal: Applied Economics, 16(1), 412–446. https://doi.org/10.1257/app.20220279
[ii] Augenblick, Palaich and Associates. (2011). Analysis of New Jersey’s Census-Based Special Education Funding System. http://nj.gov/education/sff/sereport.pdf
[iii] Baker, B.D. and Weber, M.A. (2023) Unlocking Academic Success: Revitalizing New Jersey’s School Funding Formula for Student Achievement. New Jersey Policy Perspective. https://www.njpp.org/publications/report/unlocking-academic-success-revitalizing-new-jerseys-school-funding-formula-for-student-achievement/
[iv] New Jersey Department of Education, Title I, Part A, Supplement Not Supplant Guidance https://www.nj.gov/education/title1/resources/docs/TitleISupplementnotSupplantGuidanceDocument.pdf
[v] “Median household income” is a different measure than what is used for SFRA’s formula: SFRA totals the district’s residents’ income and multiplies it by the rate. We use median income here as it better approximates the relationship between local share and the “typical” household income for a district.
[vi] “Local Fair Share ratio” is the calculated LFS amount of revenues from local sources vs. the amount from state sources. An LFS ratio of 1 (1:1) means the calculated LFS is equal to the amount from state sources; an LFS ratio of 0.5 (1:2) means the calculated LFS is equal to one-half of the amount from state sources. As tax capacity rises, the LFS ratio will also rise; for example, districts with a LFS of 2 will have greater property wealth and income—and, consequently, tax capacity—than districts with an LFS of 0.5.
[vii] Baker, B.D. and Weber, M.A. (2022) Separate and Unequal: Racial and Ethnic Segregation and the Case for School Funding Reparations in New Jersey. New Jersey Policy Perspective. https://www.njpp.org/publications/report/separate-and-unequal-racial-and-ethnic-segregation-and-the-case-for-school-funding-reparations-in-new-jersey/
[viii] Brent, B. O. (1999). An analysis of the influence of regional nonresidential expanded tax base approaches to school finance on measures of student and taxpayer equity. Journal of Education Finance, 24(3), 353-378.
Ladd, H. F., & Harris, E. W. (1995). Statewide taxation of nonresidential property for education. Journal of Education Finance, 21(1), 103-122.
Ladd, H. F. (1976). State-wide taxation of commercial and industrial property for education. National Tax Journal, 29(2), 143-153.
[ix] See Footnote #1.
[x] Baker, B.D. and Weber, M.A. (2022) New Jersey School Funding: The Higher the Goals, the Higher the Costs. New Jersey Policy Perspective. https://www.njpp.org/publications/report/new-jersey-school-funding-the-higher-the-goals-the-higher-the-costs/
[xi] Baker, B.D. and Weber, M.A. (2023) Unlocking Academic Success: Revitalizing New Jersey’s School Funding Formula for Student Achievement. New Jersey Policy Perspective. https://www.njpp.org/publications/report/unlocking-academic-success-revitalizing-new-jerseys-school-funding-formula-for-student-achievement/
[xii] Baker, B.D. and Weber, M.A. (2020) School Funding in New Jersey: A Fair Future for All. New Jersey Policy Perspective. https://www.njpp.org/publications/report/school-funding-in-new-jersey-a-fair-future-for-all/
[xiii] Baker, B.D. and Weber, M.A. (2023) Unlocking Academic Success: Revitalizing New Jersey’s School Funding Formula for Student Achievement. New Jersey Policy Perspective. https://www.njpp.org/publications/report/unlocking-academic-success-revitalizing-new-jerseys-school-funding-formula-for-student-achievement/
[xiv] Baker, B. D., Weber, M., & Srikanth, A. (2021). Informing Federal School Finance Policy with Empirical Evidence. Journal of Education Finance, 47(1), 1–25.
[xv] Baker, B.D. and Weber, M.A. (2022) New Jersey School Funding: The Higher the Goals, the Higher the Costs. New Jersey Policy Perspective. https://www.njpp.org/publications/report/new-jersey-school-funding-the-higher-the-goals-the-higher-the-costs/
[xvi] Baker, B.D. and Weber, M.A. (2023) Unlocking Academic Success: Revitalizing New Jersey’s School Funding Formula for Student Achievement. New Jersey Policy Perspective. https://www.njpp.org/publications/report/unlocking-academic-success-revitalizing-new-jerseys-school-funding-formula-for-student-achievement/
[xvii] School Finance Indicators Database, State School Finance Profile, New Jersey, 2020-21 School Year https://www.schoolfinancedata.org/wp-content/uploads/2024/01/profiles24_NJ.pdf