To read a PDF version of the full report, click here.
Labor Day is a time to pay tribute to the social and economic achievements of workers and the broader labor movement. This year, essential workers are courageously keeping New Jersey’s economy and communities running despite the current health crisis. Nevertheless, these workers, among others, continue to encounter barriers to economic security and threats to their health and safety. Moreover, the challenges faced by many families as they juggle caregiving and work have become increasingly untenable. These conditions have both highlighted and deepened inequities in our workforce, as workers who are Black, immigrant, and low-income are at disproportionately high risk of exposure to the health and economic harms of COVID-19.[1]
This Labor Day, we examine the state of working New Jersey, with particular attention to the impact of COVID-19 on workers and their families. While the state government has taken several steps to improve wages, benefits, and protections for workers in recent years, including increasing the minimum wage, improving paid leave, and boosting enforcement of worker misclassification,[2] workers in New Jersey continue to face challenging conditions. This brief provides an overview of policies that would further strengthen workers’ rights and promote public health and economic security both during and beyond the current crisis.
Hourly Wage Growth Remains Slow and Uneven
While COVID-19 has created new complications for workers, income inequality was a growing problem long before the onset of the pandemic. One factor driving income inequality is the near stagnation of hourly wages for most New Jersey workers.
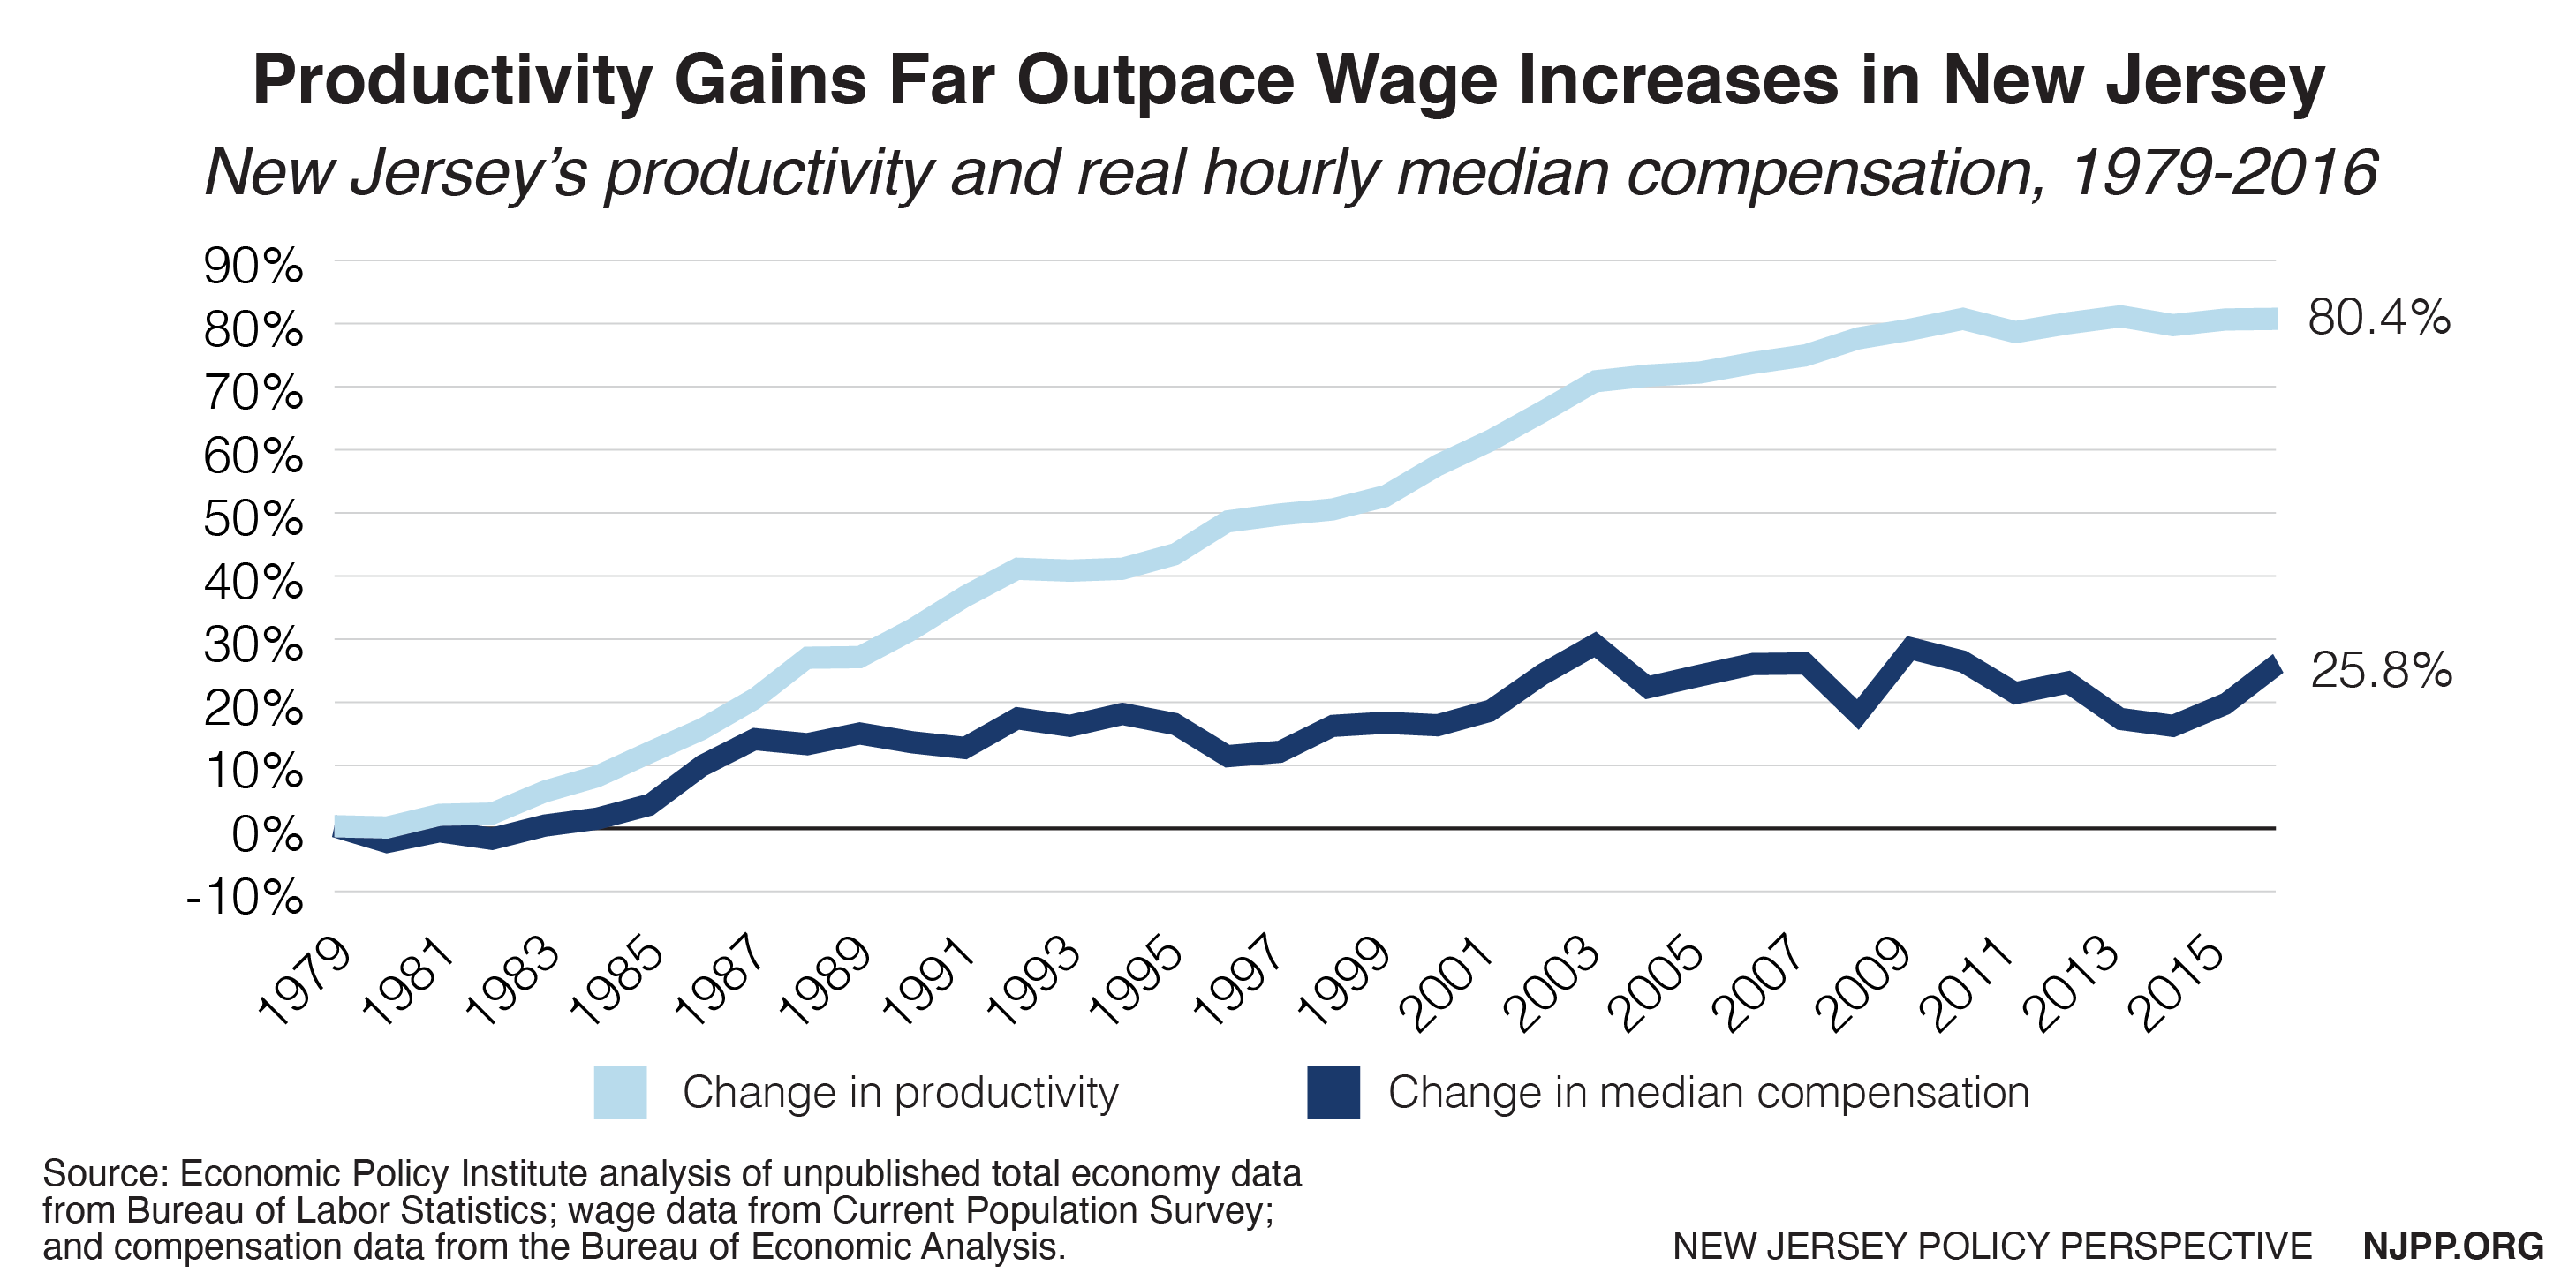
From World War II through the 1970s, wages and productivity grew in lockstep, building the middle class. Since the late 1970s, however, the gap between productivity and wages has steadily widened. While productivity has increased, hourly wages for most workers have remained stagnant or grown modestly. Between 1979 and 2016, productivity in New Jersey grew 80.4 percent, while median hourly compensation grew just 25.8 percent.[3]
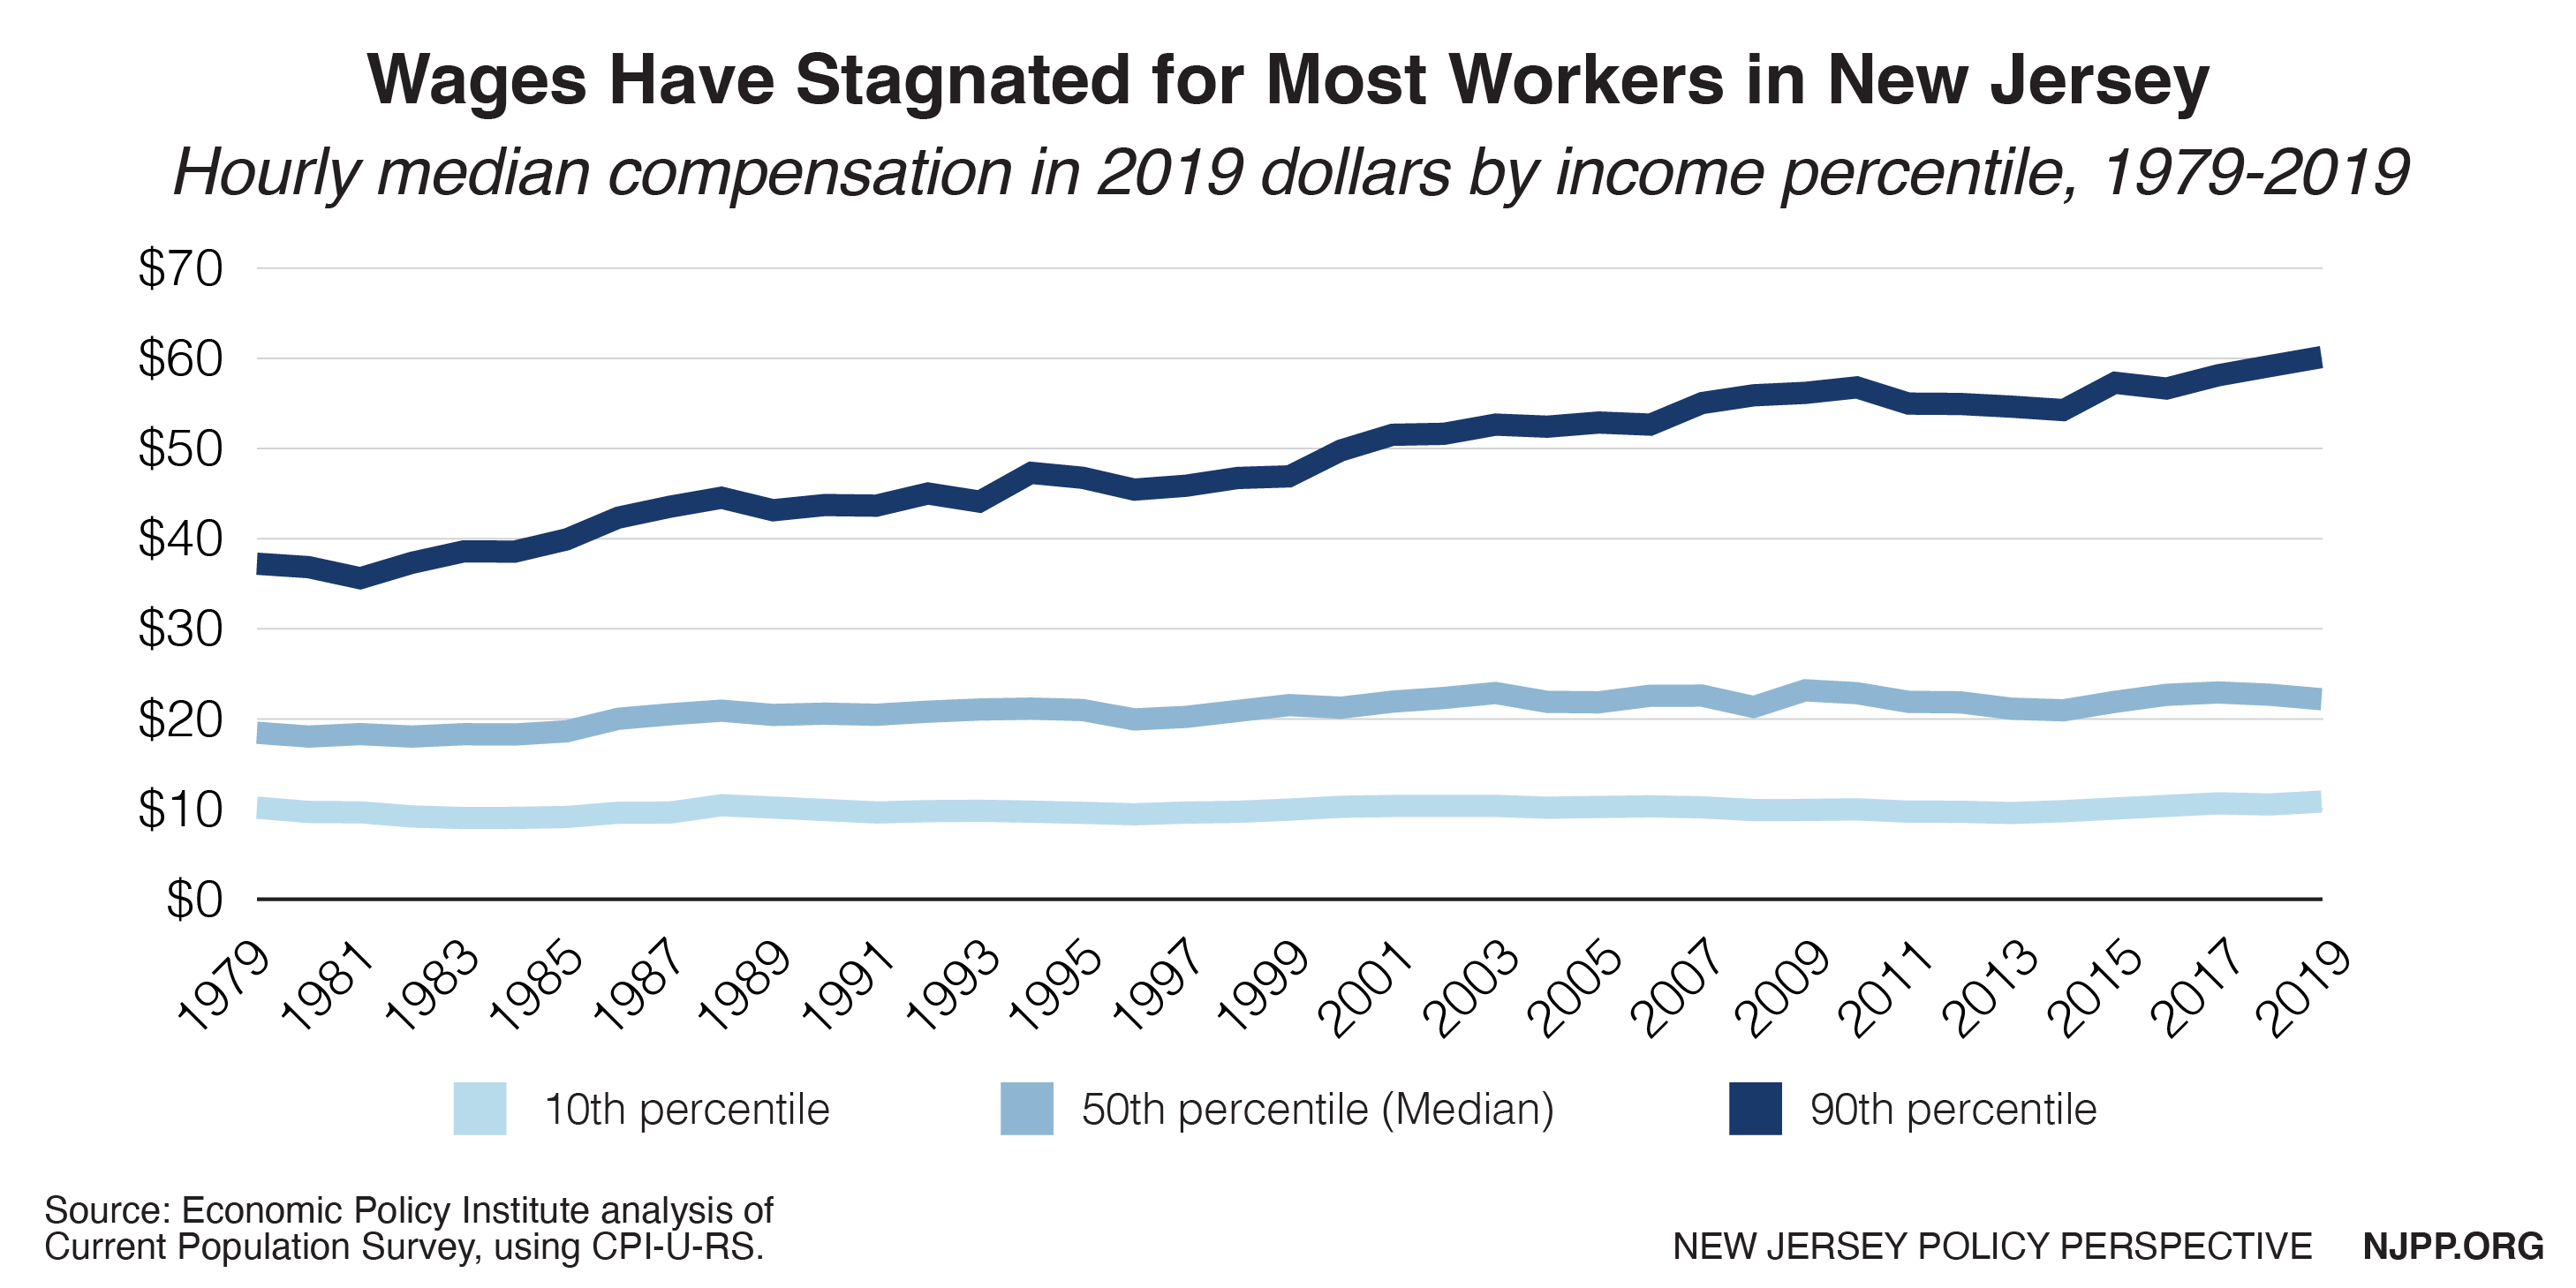
During the same time, wages of the lowest income earners in New Jersey have remained stagnant. The wages of workers at the 10th percentile — $10.60 an hour in 2019 — have only increased 7 percent (68 cents) in total since 1979, adjusted to inflation. Recent minimum wage increases have since contributed to modest wage growth for some low wage workers, but these have yet to rectify decades of stagnation. For example, wages for the lowest paid workers decreased between 2010 and 2013, but increased when the New Jersey minimum wage increased from $7.25 to $8.25 per hour in 2014.[4] The state’s minimum wage, which has since seen additional increases, rose to $11.00 per hour at the start of 2020 and is scheduled to reach $15.00 an hour by 2024.[5] Median-wage workers in New Jersey have fared only slightly better, with a moderate hourly wage increase of 20 percent ($3.72) since 1979. In contrast, the hourly wages of high wage workers in the 90th percentile have risen much more rapidly, increasing 62 percent ($22.92) between 1979 and 2019.
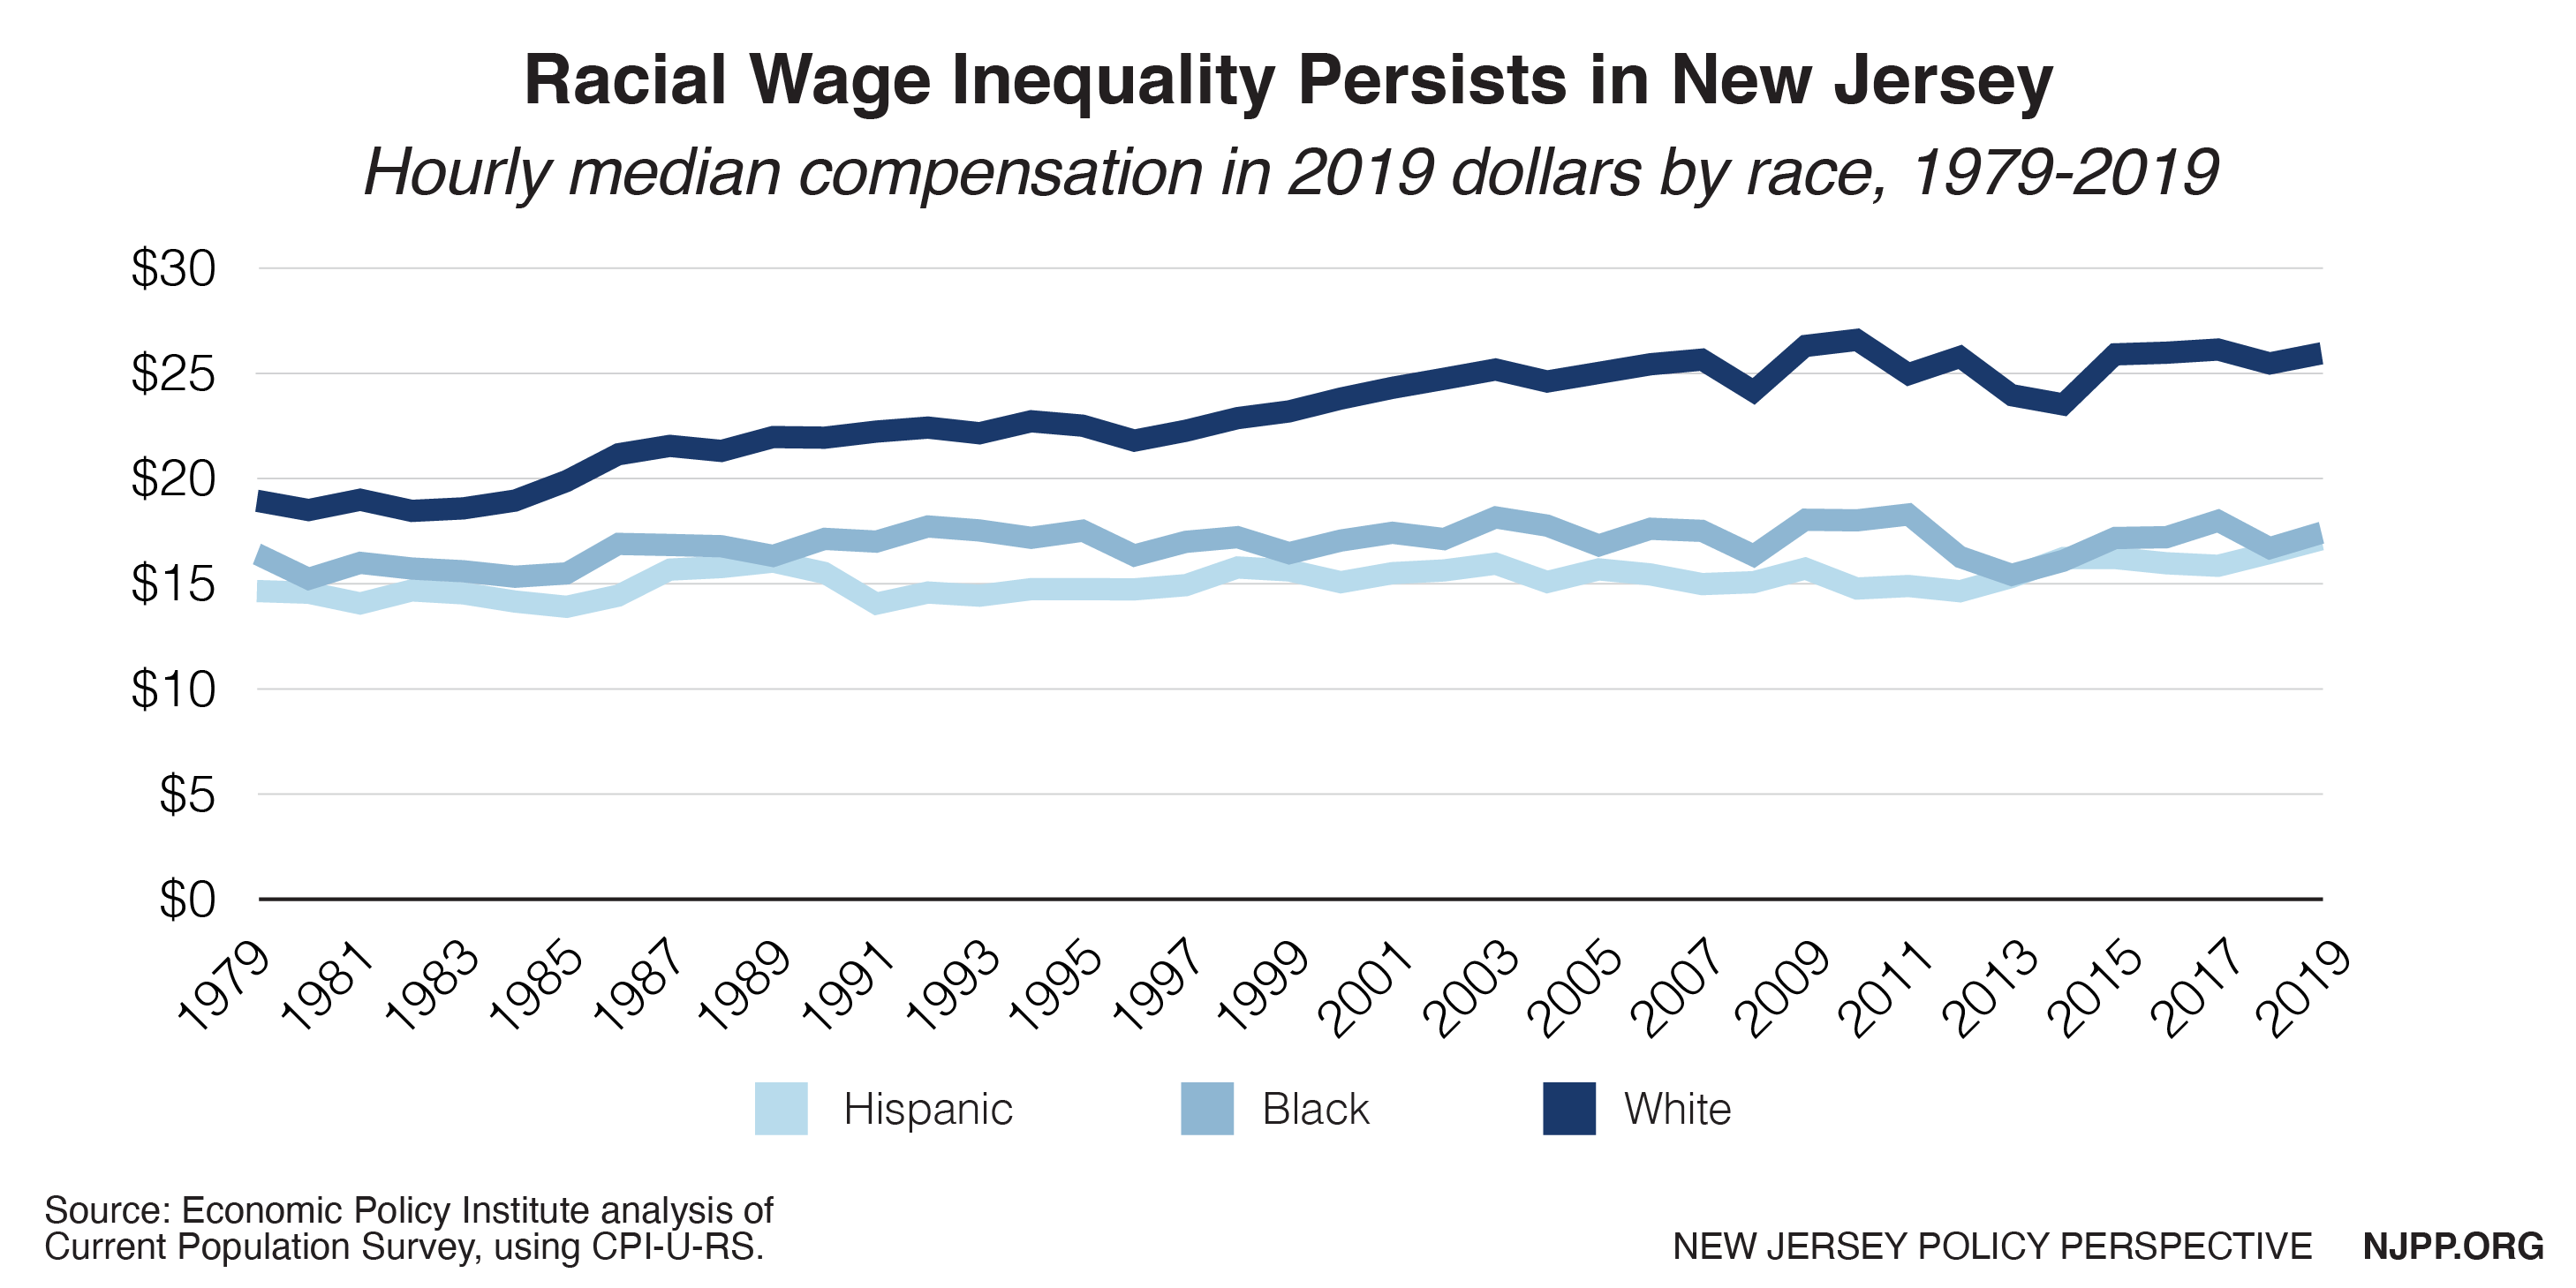
Racial disparities in hourly wages have not only persisted over the last four decades, but expanded, as the wages for white workers have increased more rapidly than for Black and Latinx workers. In 2019, the median hourly wage among white workers in New Jersey was $25.85, approximately 1.5 times the median wage among Black ($17.32) and Latinx workers ($17.01). The hourly median wage among Black workers has only increased 6 percent since 1979, and for Latinx workers, just 17 percent. Wages for white workers rose much faster, with a 37 percent increase in median hourly wage during the same period. In addition, while the overall gender wage gap in New Jersey has narrowed since 1979, women continue to earn lower wages than men,[6] and Black and Latinx women earn less than white women.[7]
Unprecedented Unemployment
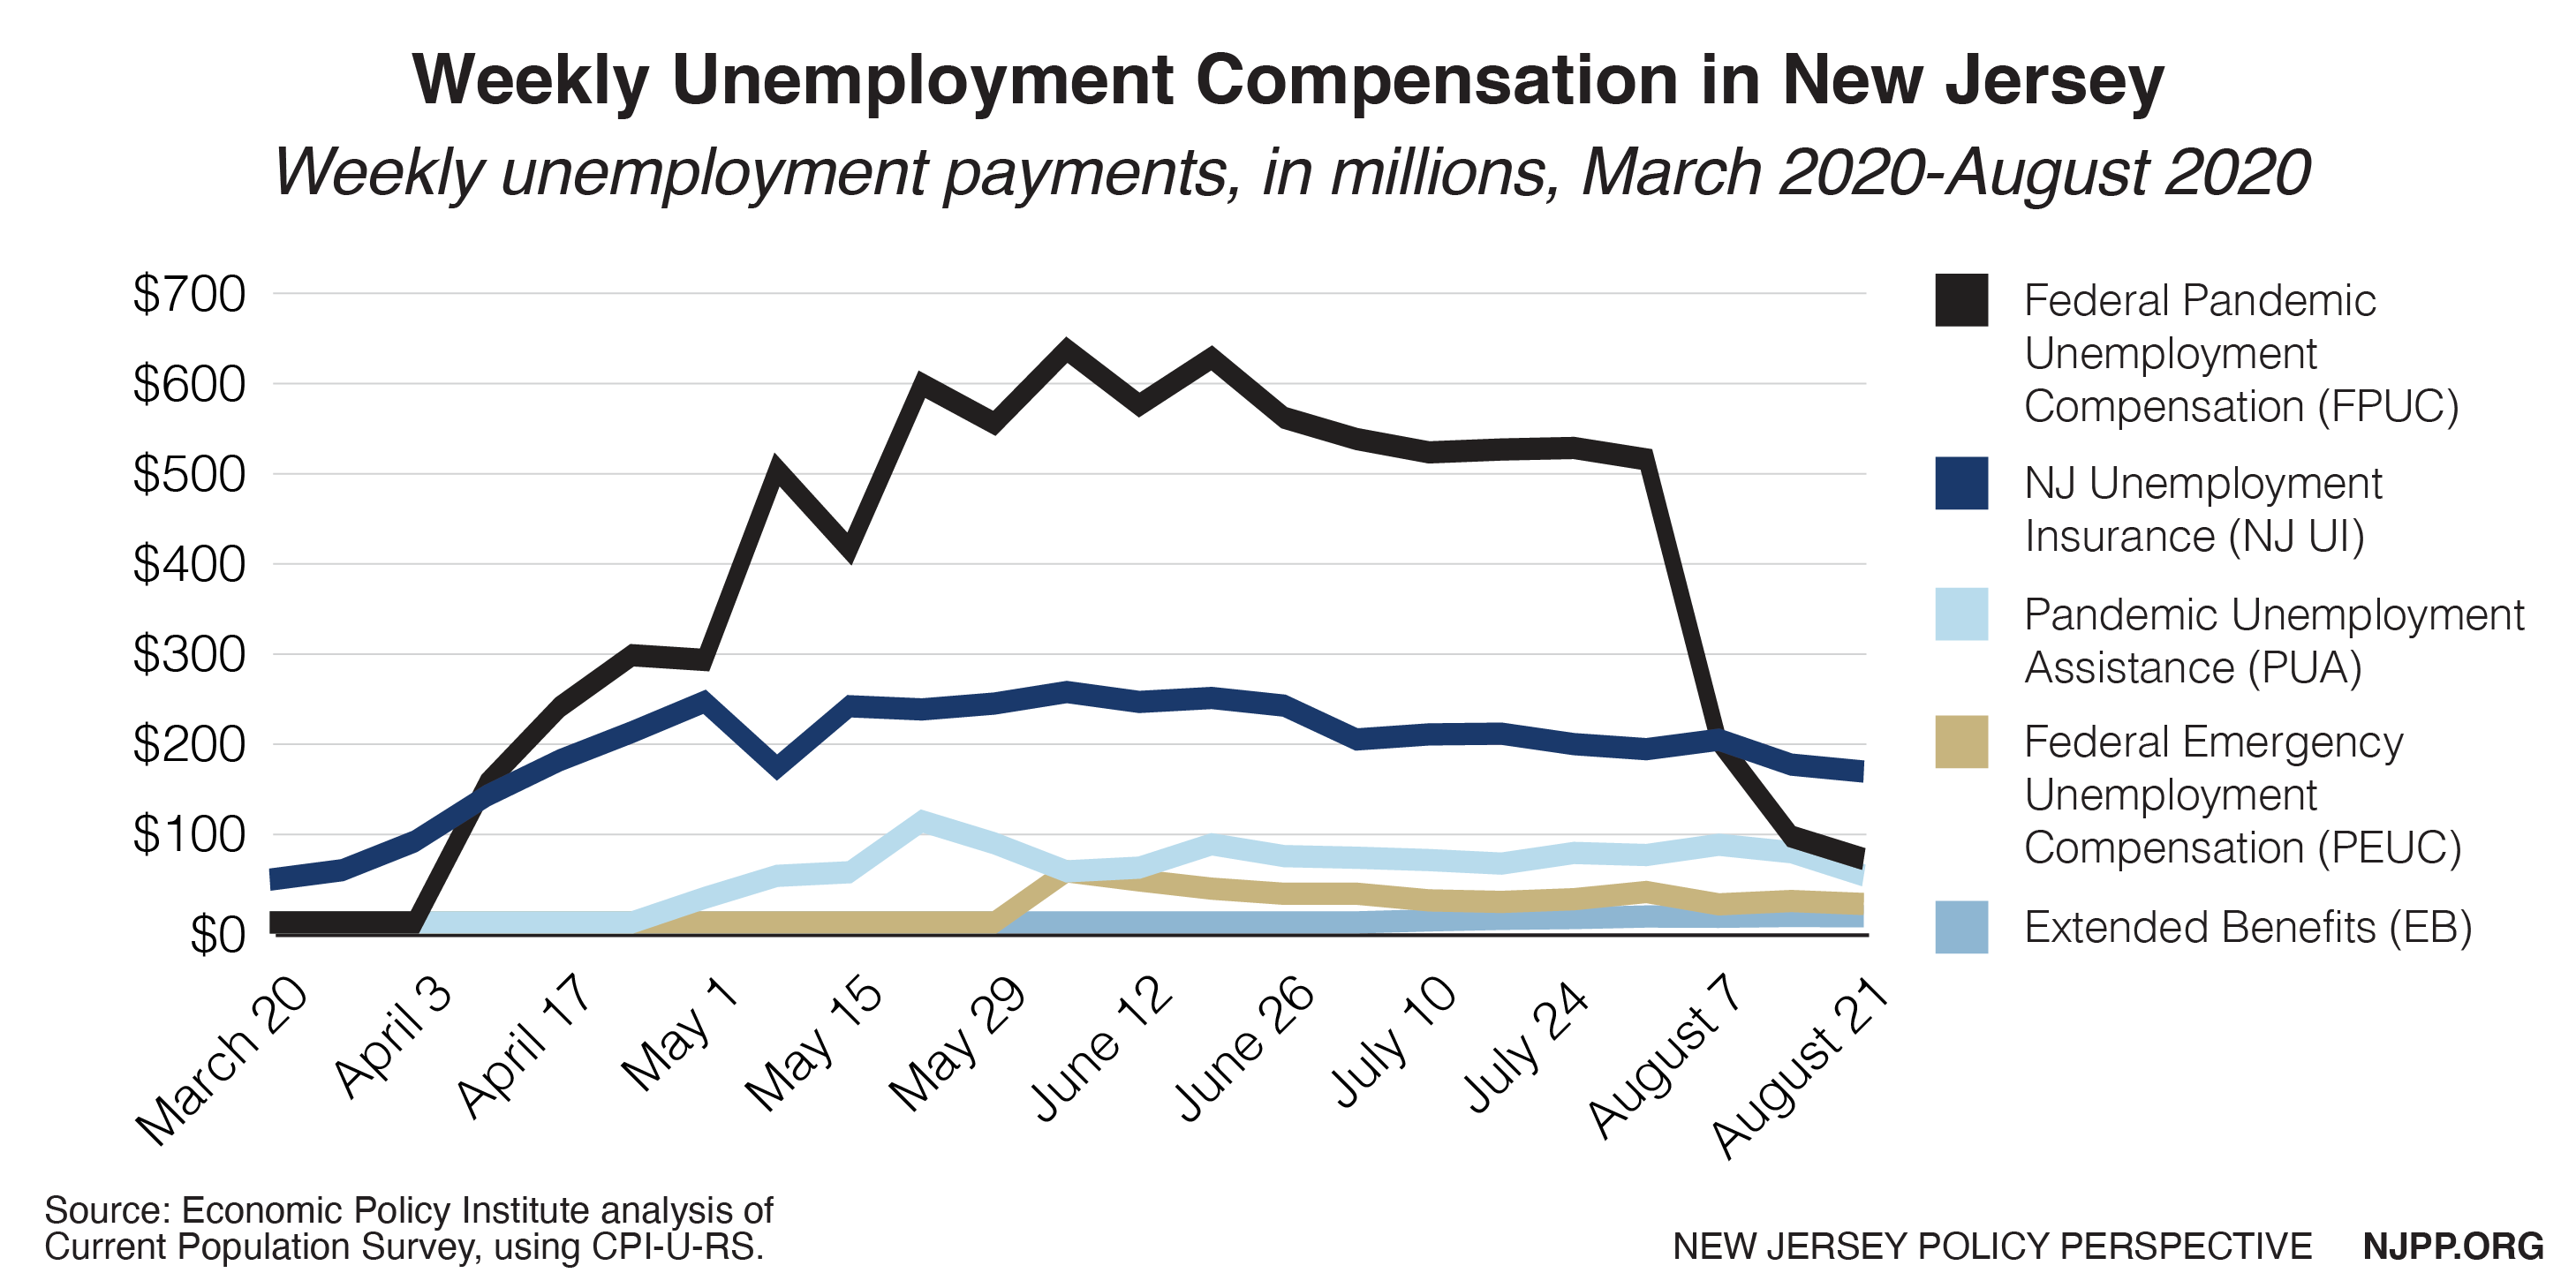
The COVID-19 crisis has brought about unprecedented levels of job loss and unemployment insurance (UI) claims. From mid-March to mid-August 2020, 1.5 million New Jerseyans filed for UI and the state paid out $4.4 billion in benefits.[8]
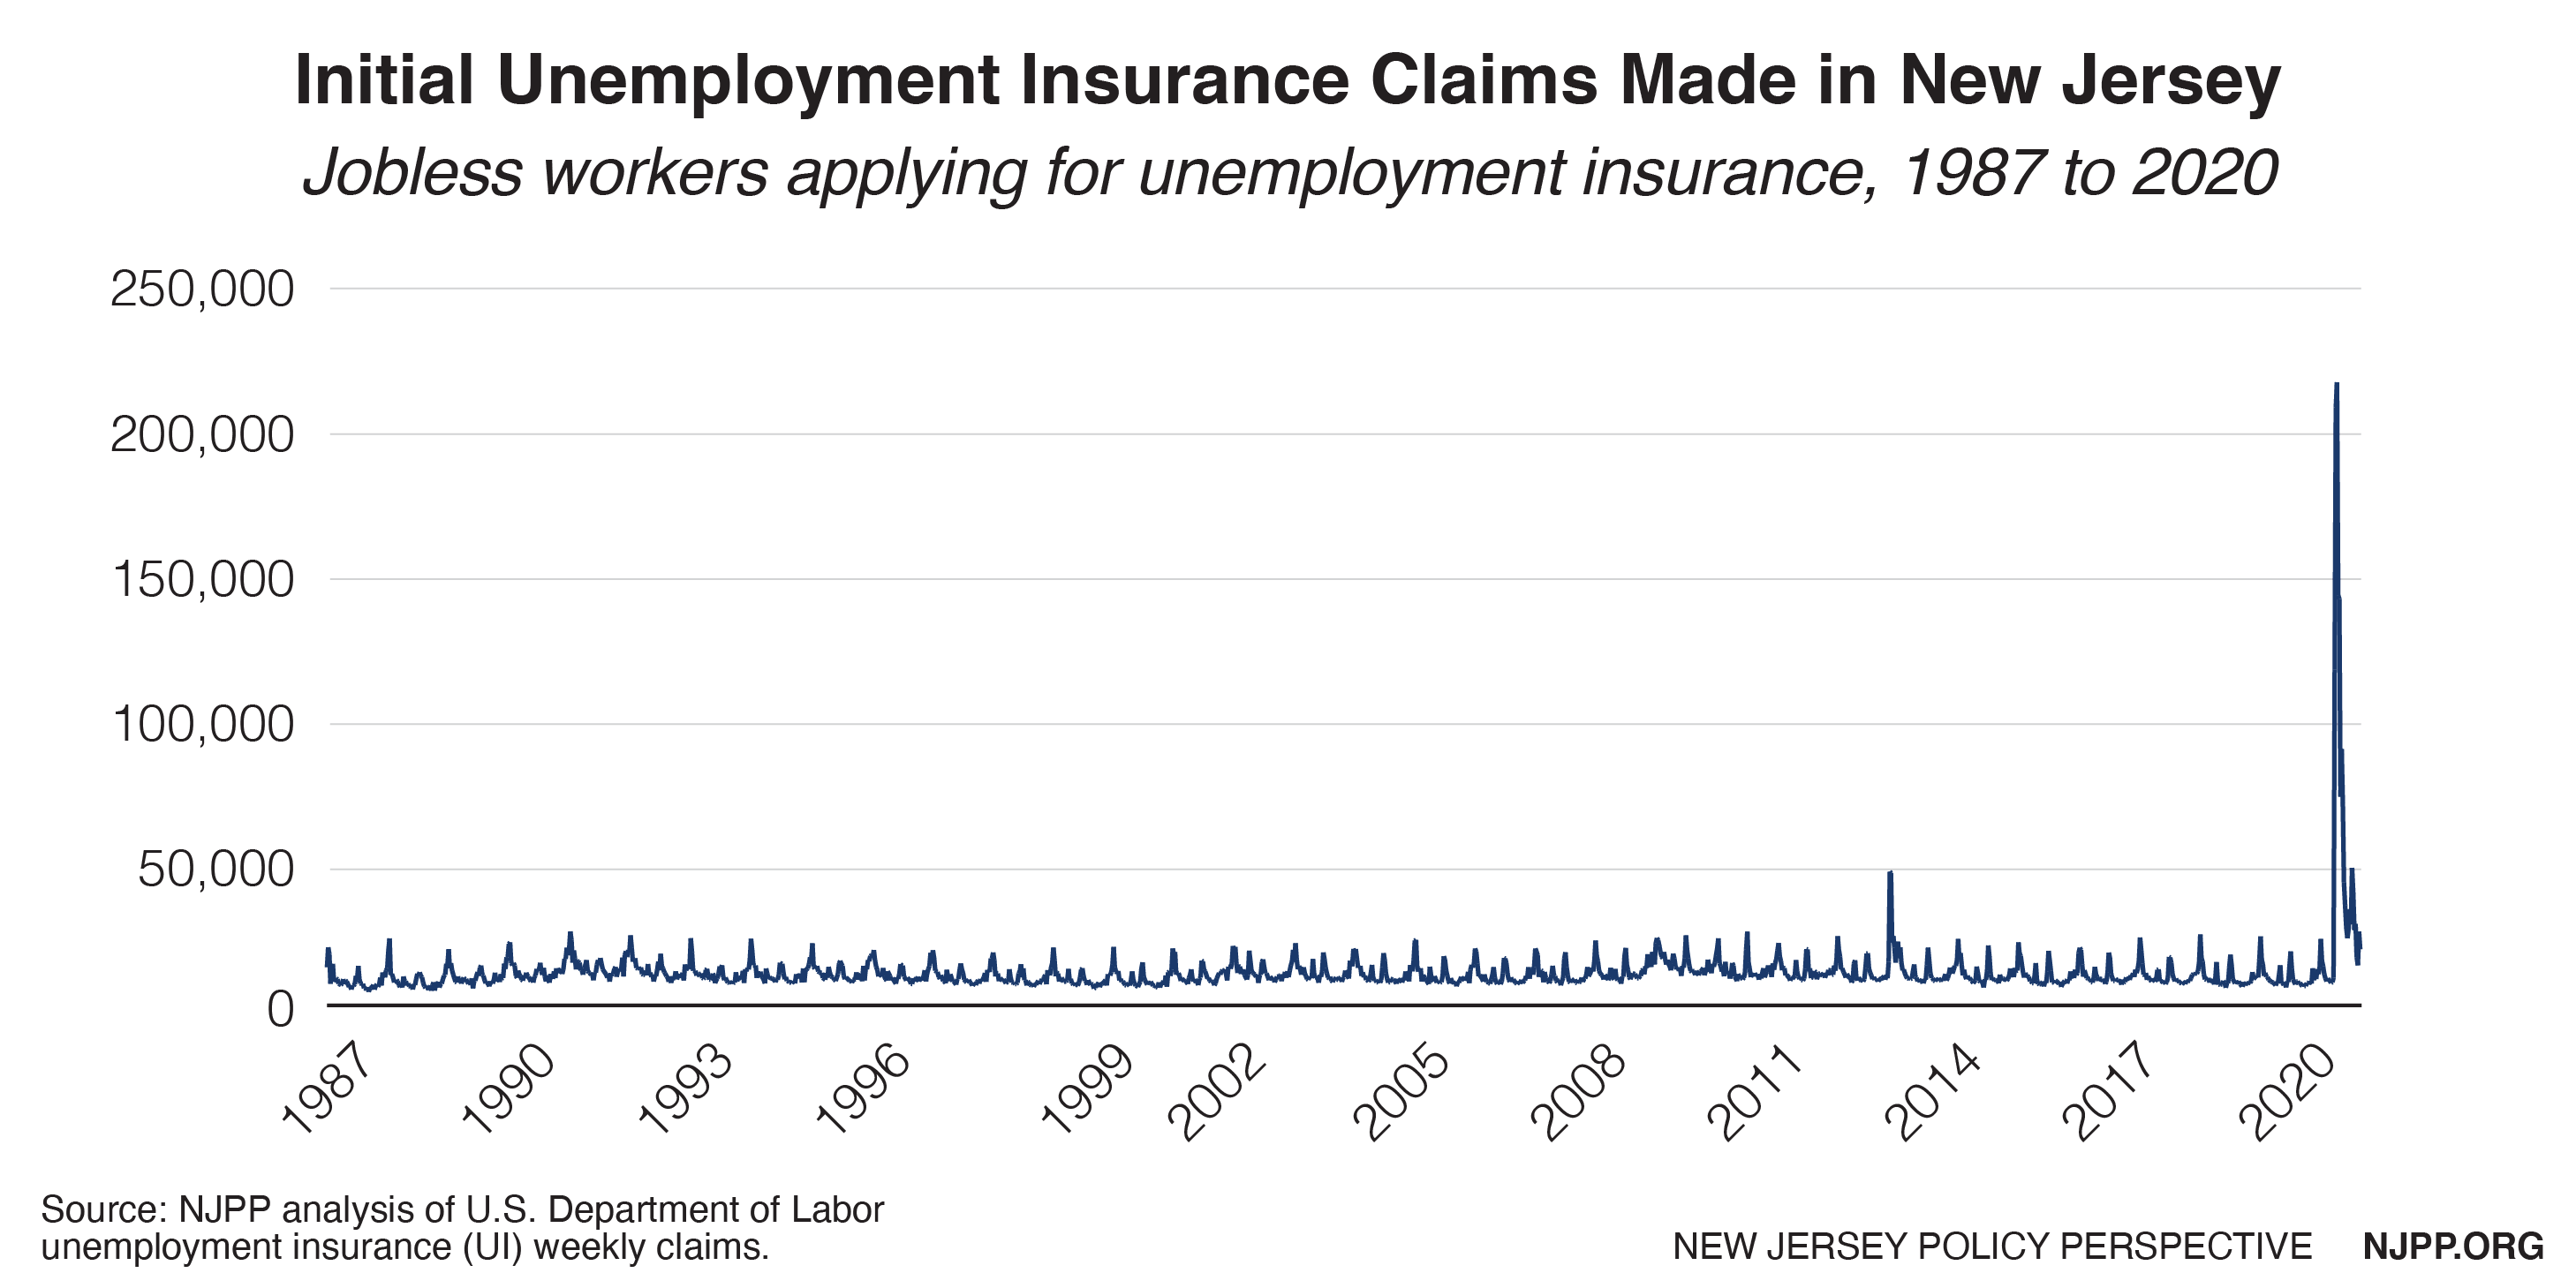
Unemployment claims have reduced in recent weeks, but claim levels remain high compared to levels prior to the pandemic. The total amount of unemployment insurance benefits paid to New Jersey workers has plummeted in recent weeks following the late July expiration of the Federal Pandemic Unemployment Compensation (FPUC), which provided a $600 weekly supplement.[9]
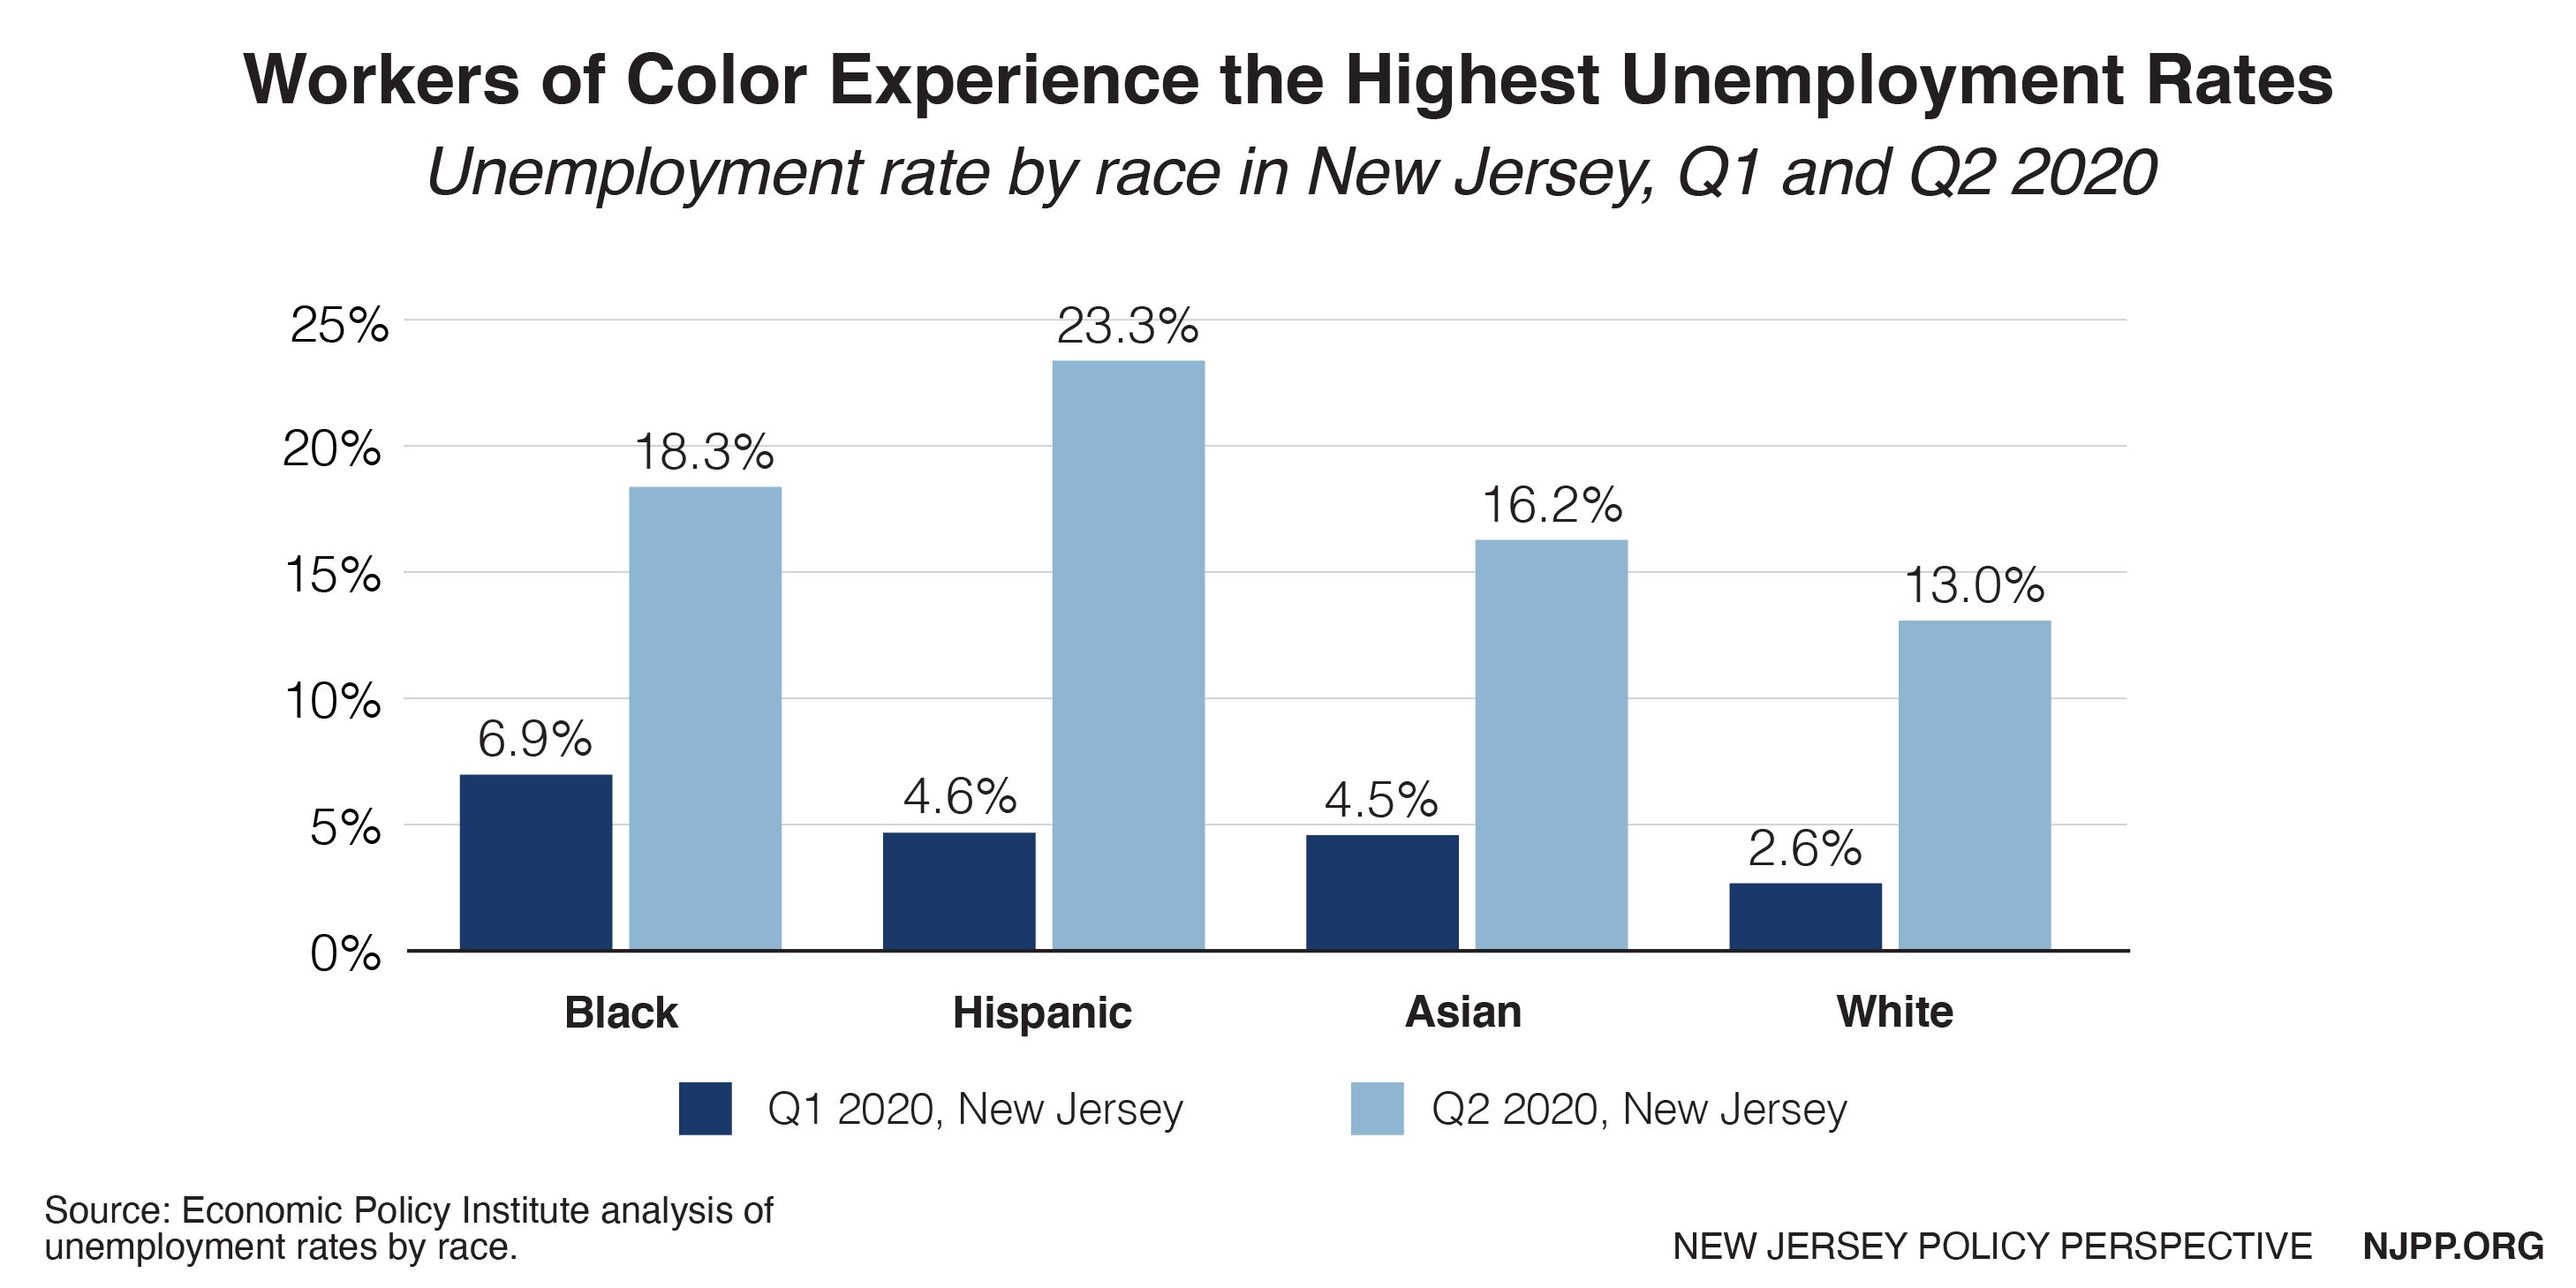
While unemployment skyrocketed across all racial and ethnic groups, the economic harms of COVID-19 are not felt evenly among New Jersey workers. Both before and during the COVID-19 pandemic, people of color continue to experience unemployment at a higher rate than white people.[10]
The Census Bureau’s most recent Household Pulse Survey, which is based on data collected between July 16 and July 21, 2020, suggests an even harsher reality than unemployment rates.[11] According to the survey, over half (55 percent) of households in New Jersey report experiencing loss of employment income since March 13, 2020. In addition, young (ages 18-24) and Latinx New Jersey residents experienced income loss particularly high rates. 72 percent of young respondents (ages 18-24) and 71 percent of Latinx respondents reported losing employment income between March 13 and July 21. Further, 30 percent of all households reported that they expect to lose employment income in the following four weeks.
Threats to Worker Health and Safety
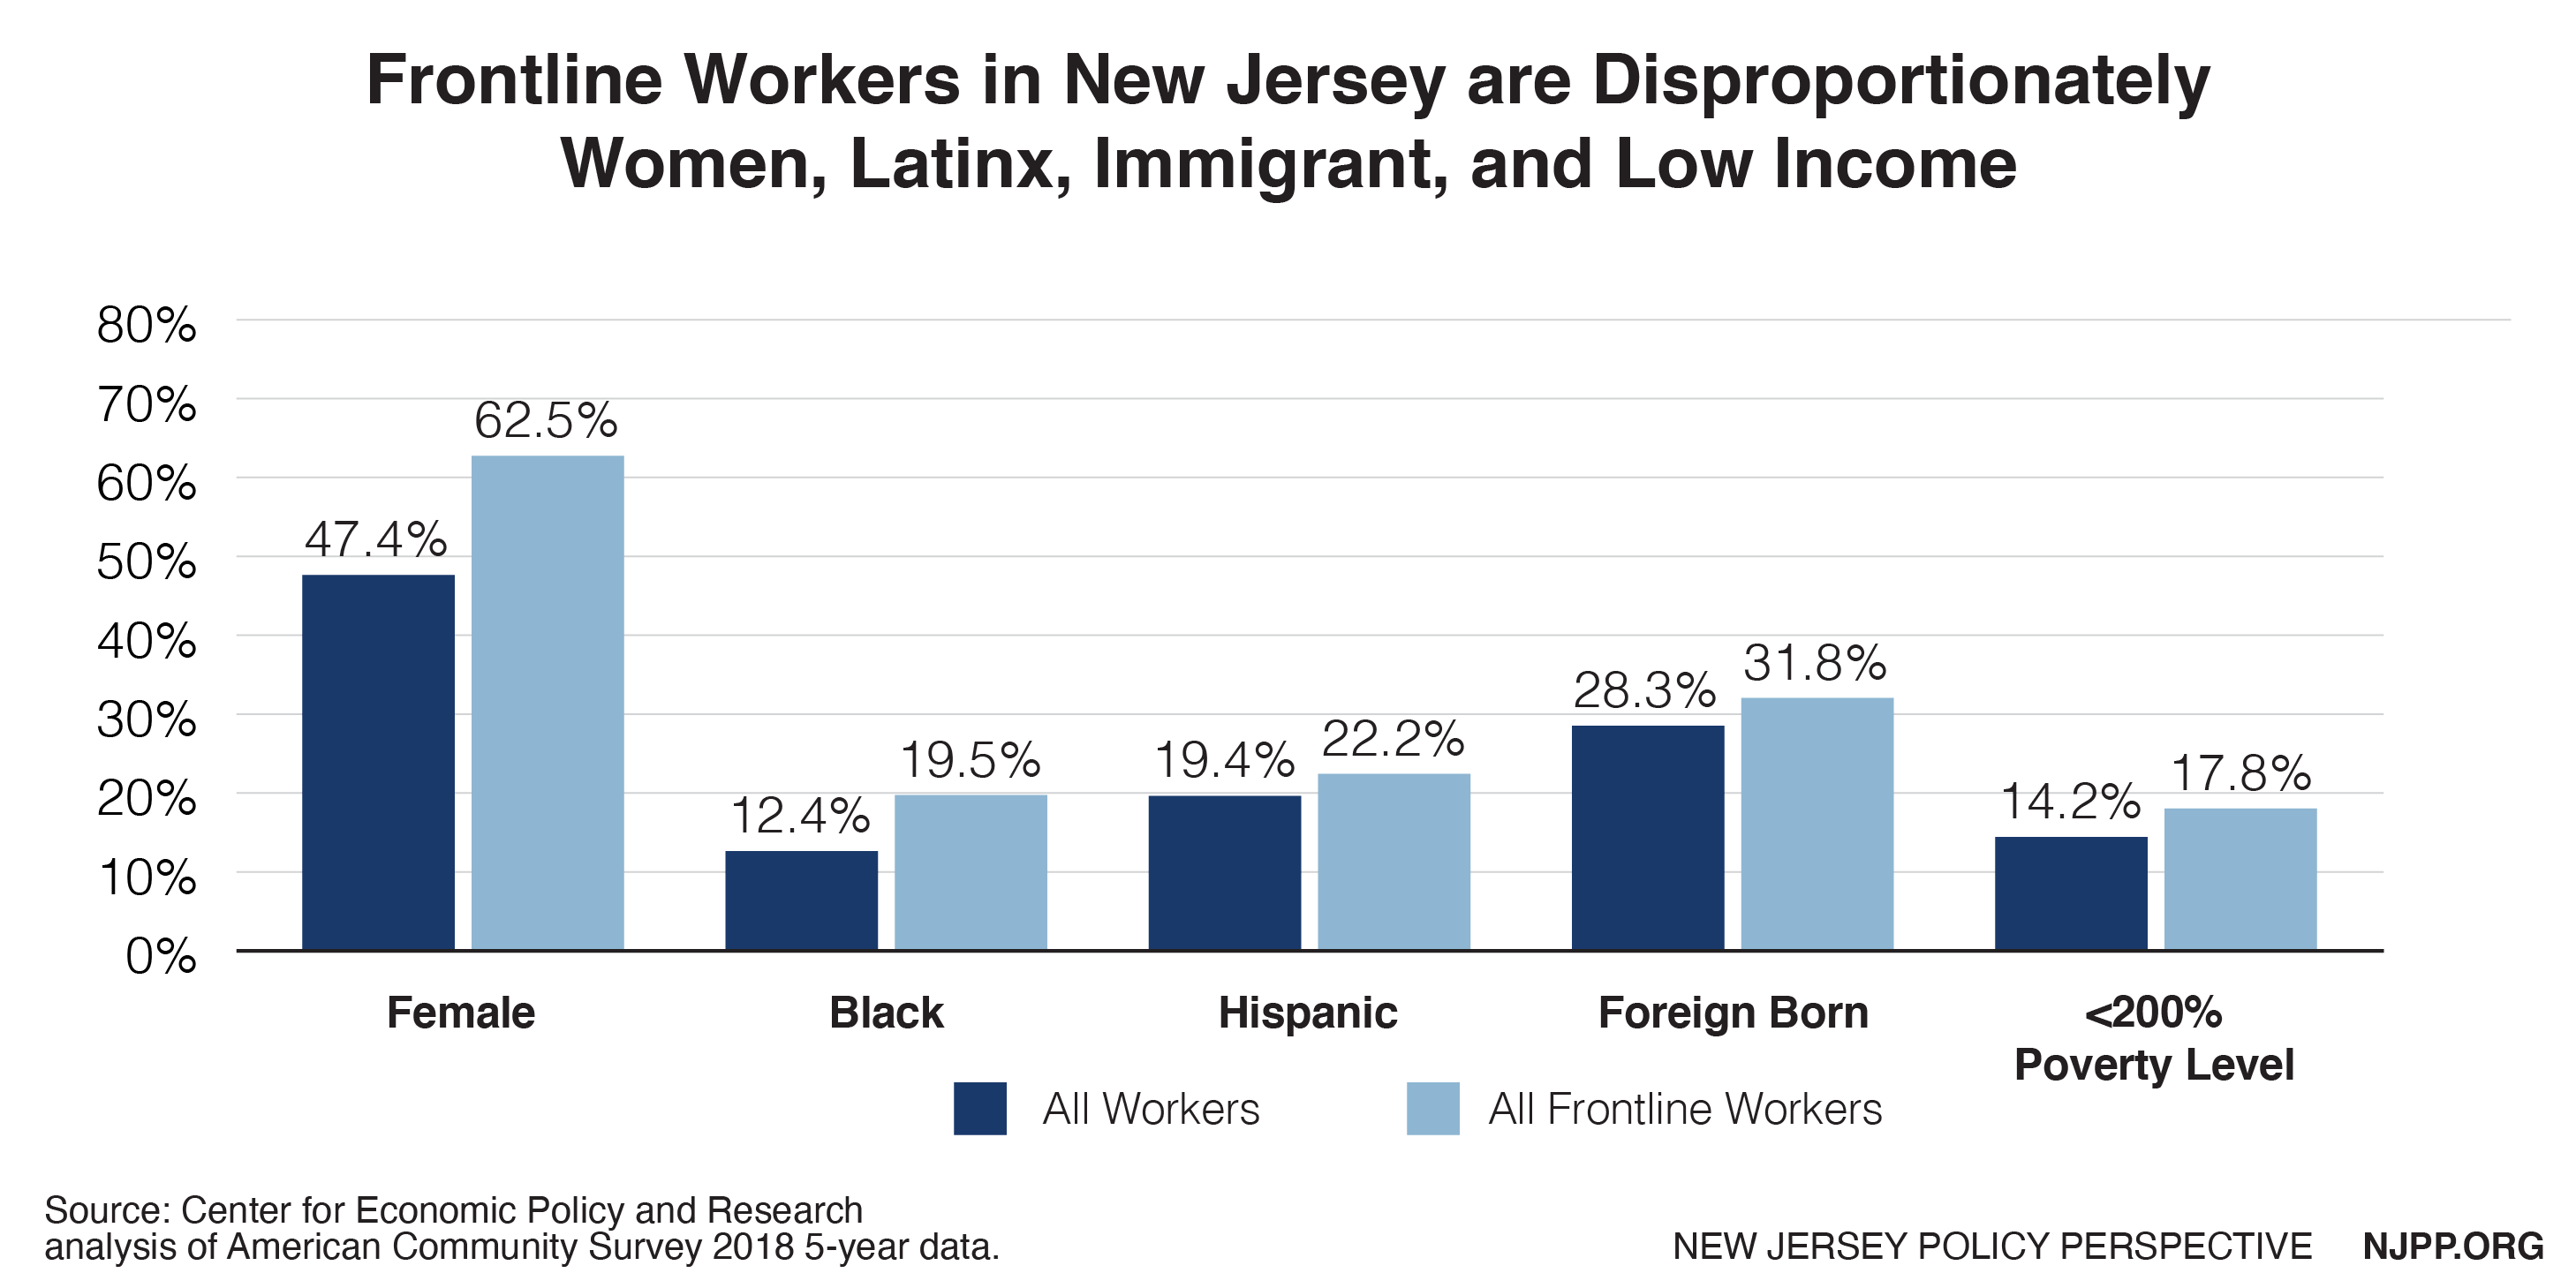
Workers on the frontlines of the pandemic response, including those in industries like health care, public transportation, and cleaning services, are often underpaid and lack protections. The impact of inadequate safeguards for workers is clear. In New Jersey’s long-term care facilities alone, 13,368 staff members have contracted COVID-19 and 121 have died.[12] Moreover, workers in frontline industries are more likely to earn low and moderate incomes (less than 200 percent of the poverty line) than the workforce overall.[13] The COVID-19 pandemic has intensified the already challenging circumstances that these workers must navigate.
Many essential workers also face structural barriers to economic security and rights. In New Jersey, women are much more likely to be essential workers than men. While women make up less than half (47.4 percent) of New Jersey’s workforce, 62.5 percent of workers in frontline industries are women. In addition, Black, Latinx, and immigrant workers are disproportionately represented among essential workers, making up a higher percentage of the workers in frontline industries than in the workforce overall. For example, while Black workers make up only 12.4 percent of the overall workforce, nearly 20 percent of workers in frontline industries are Black. [14]
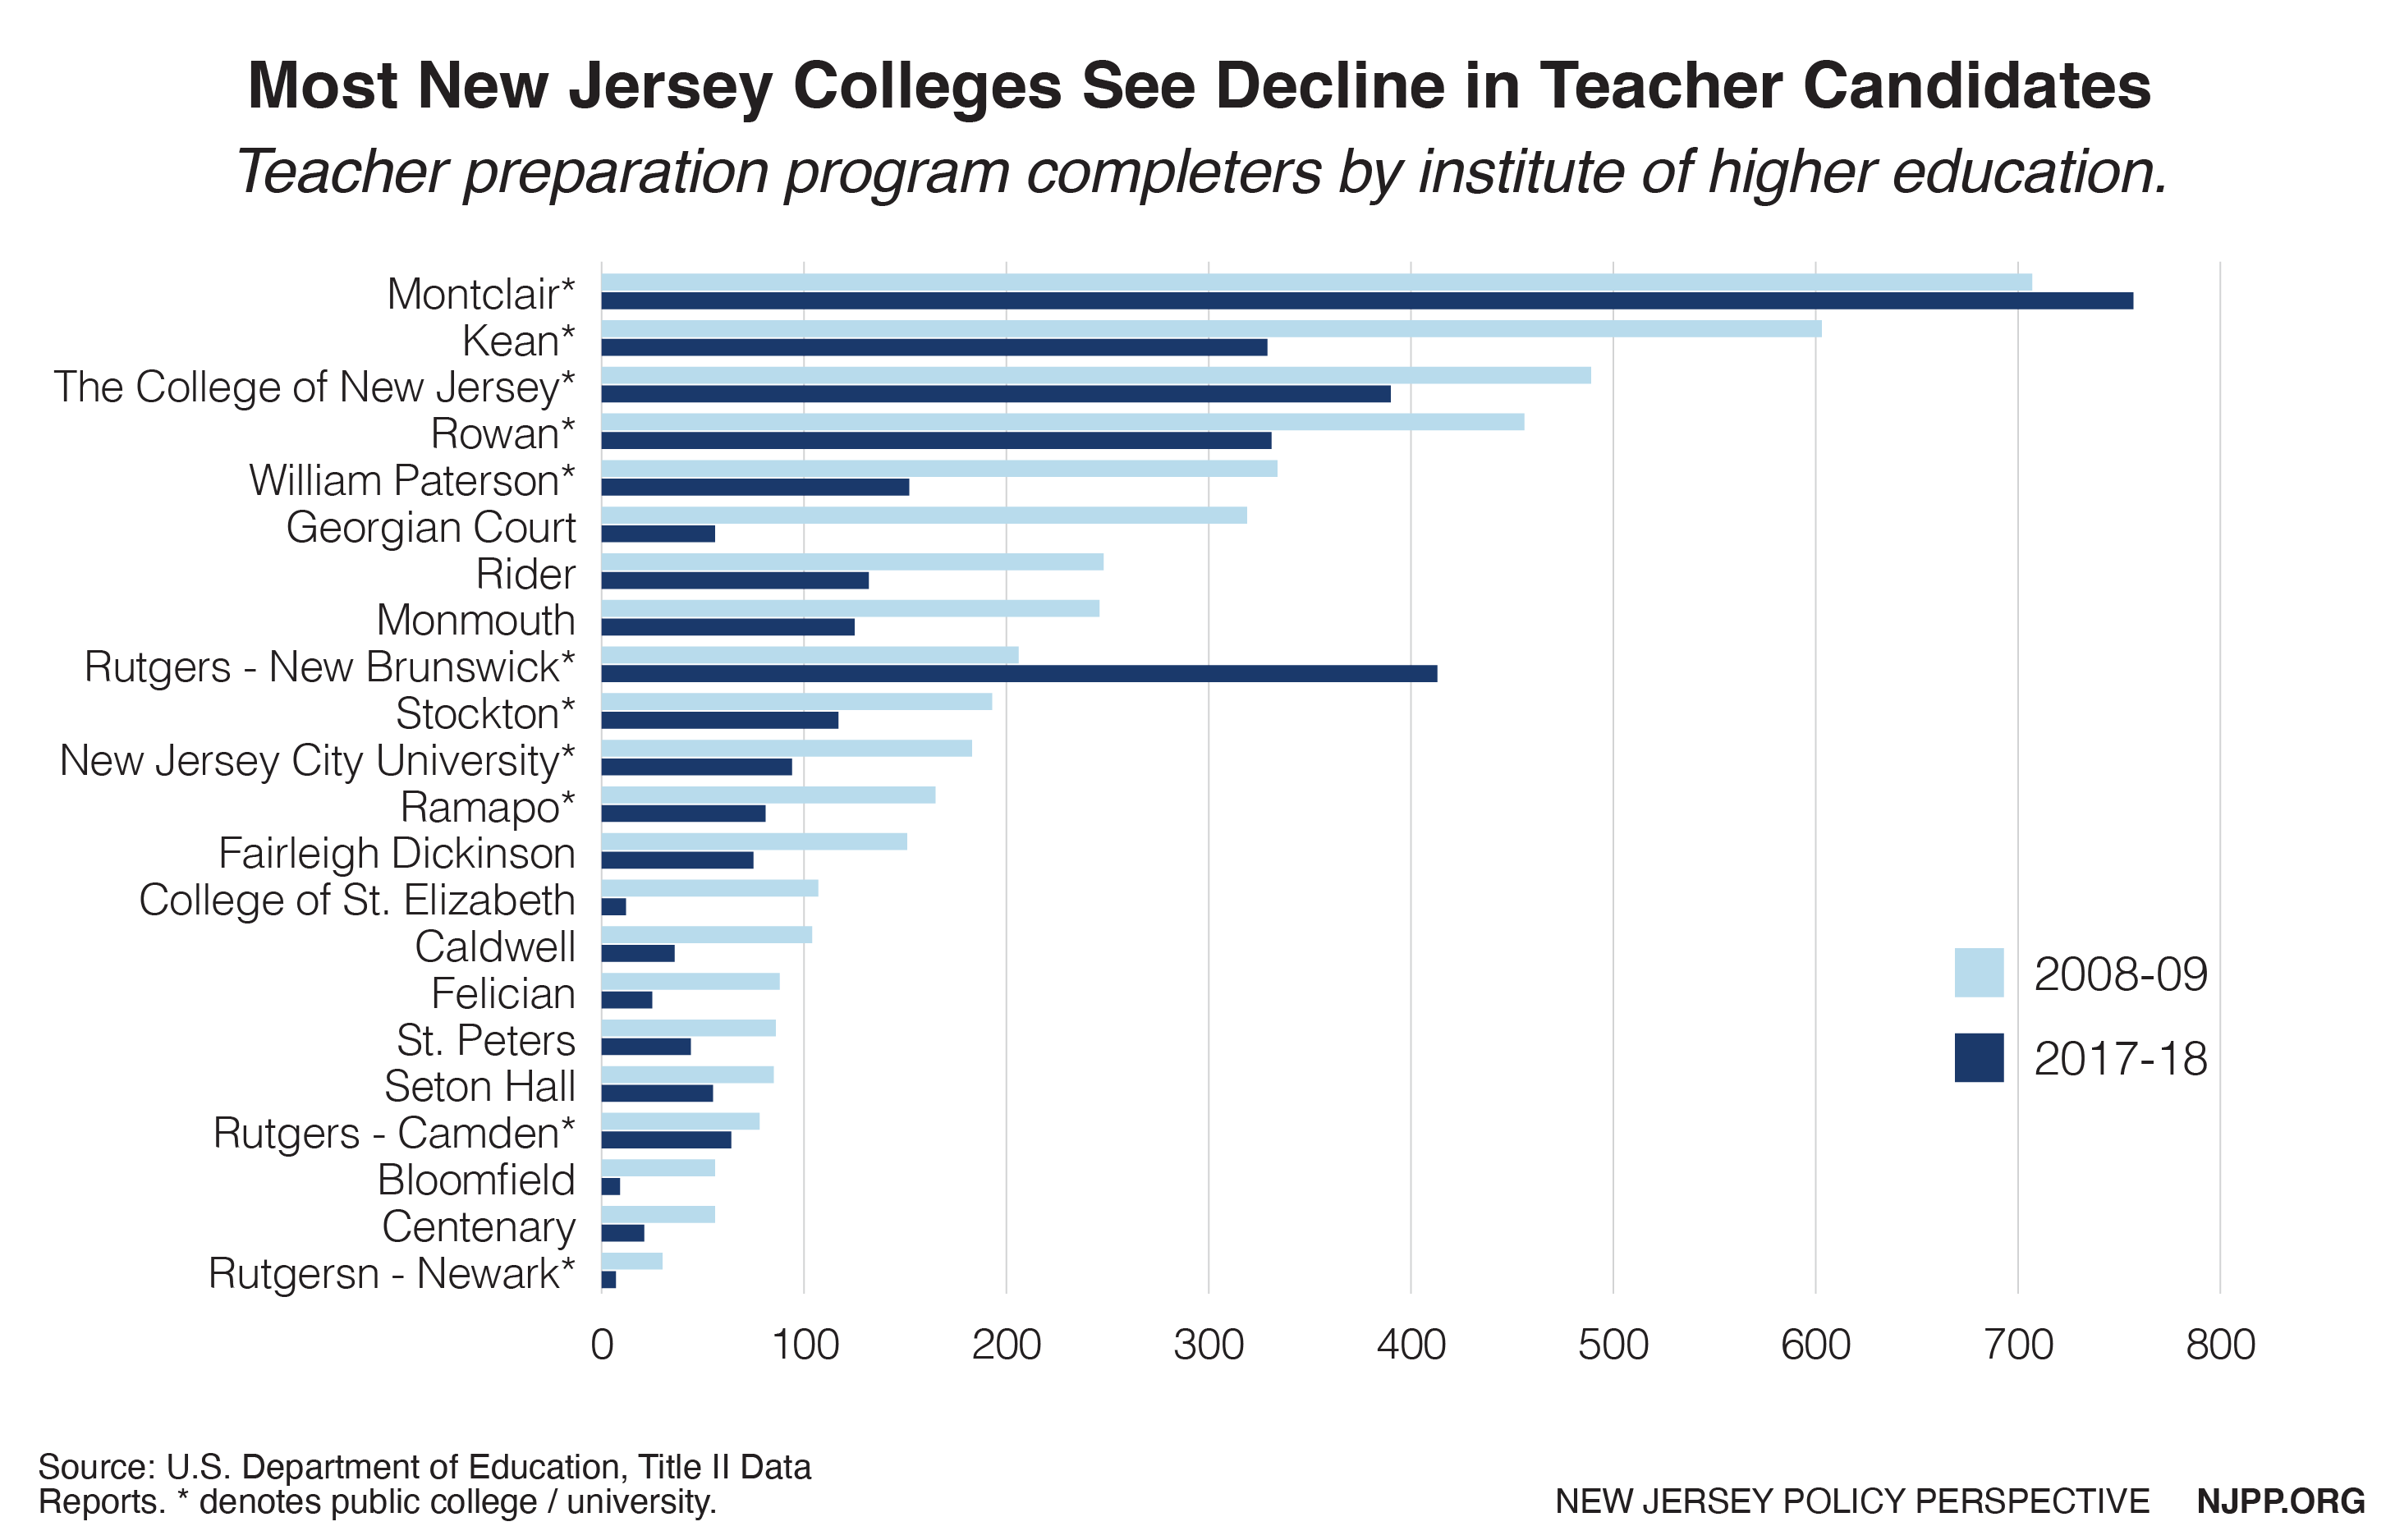
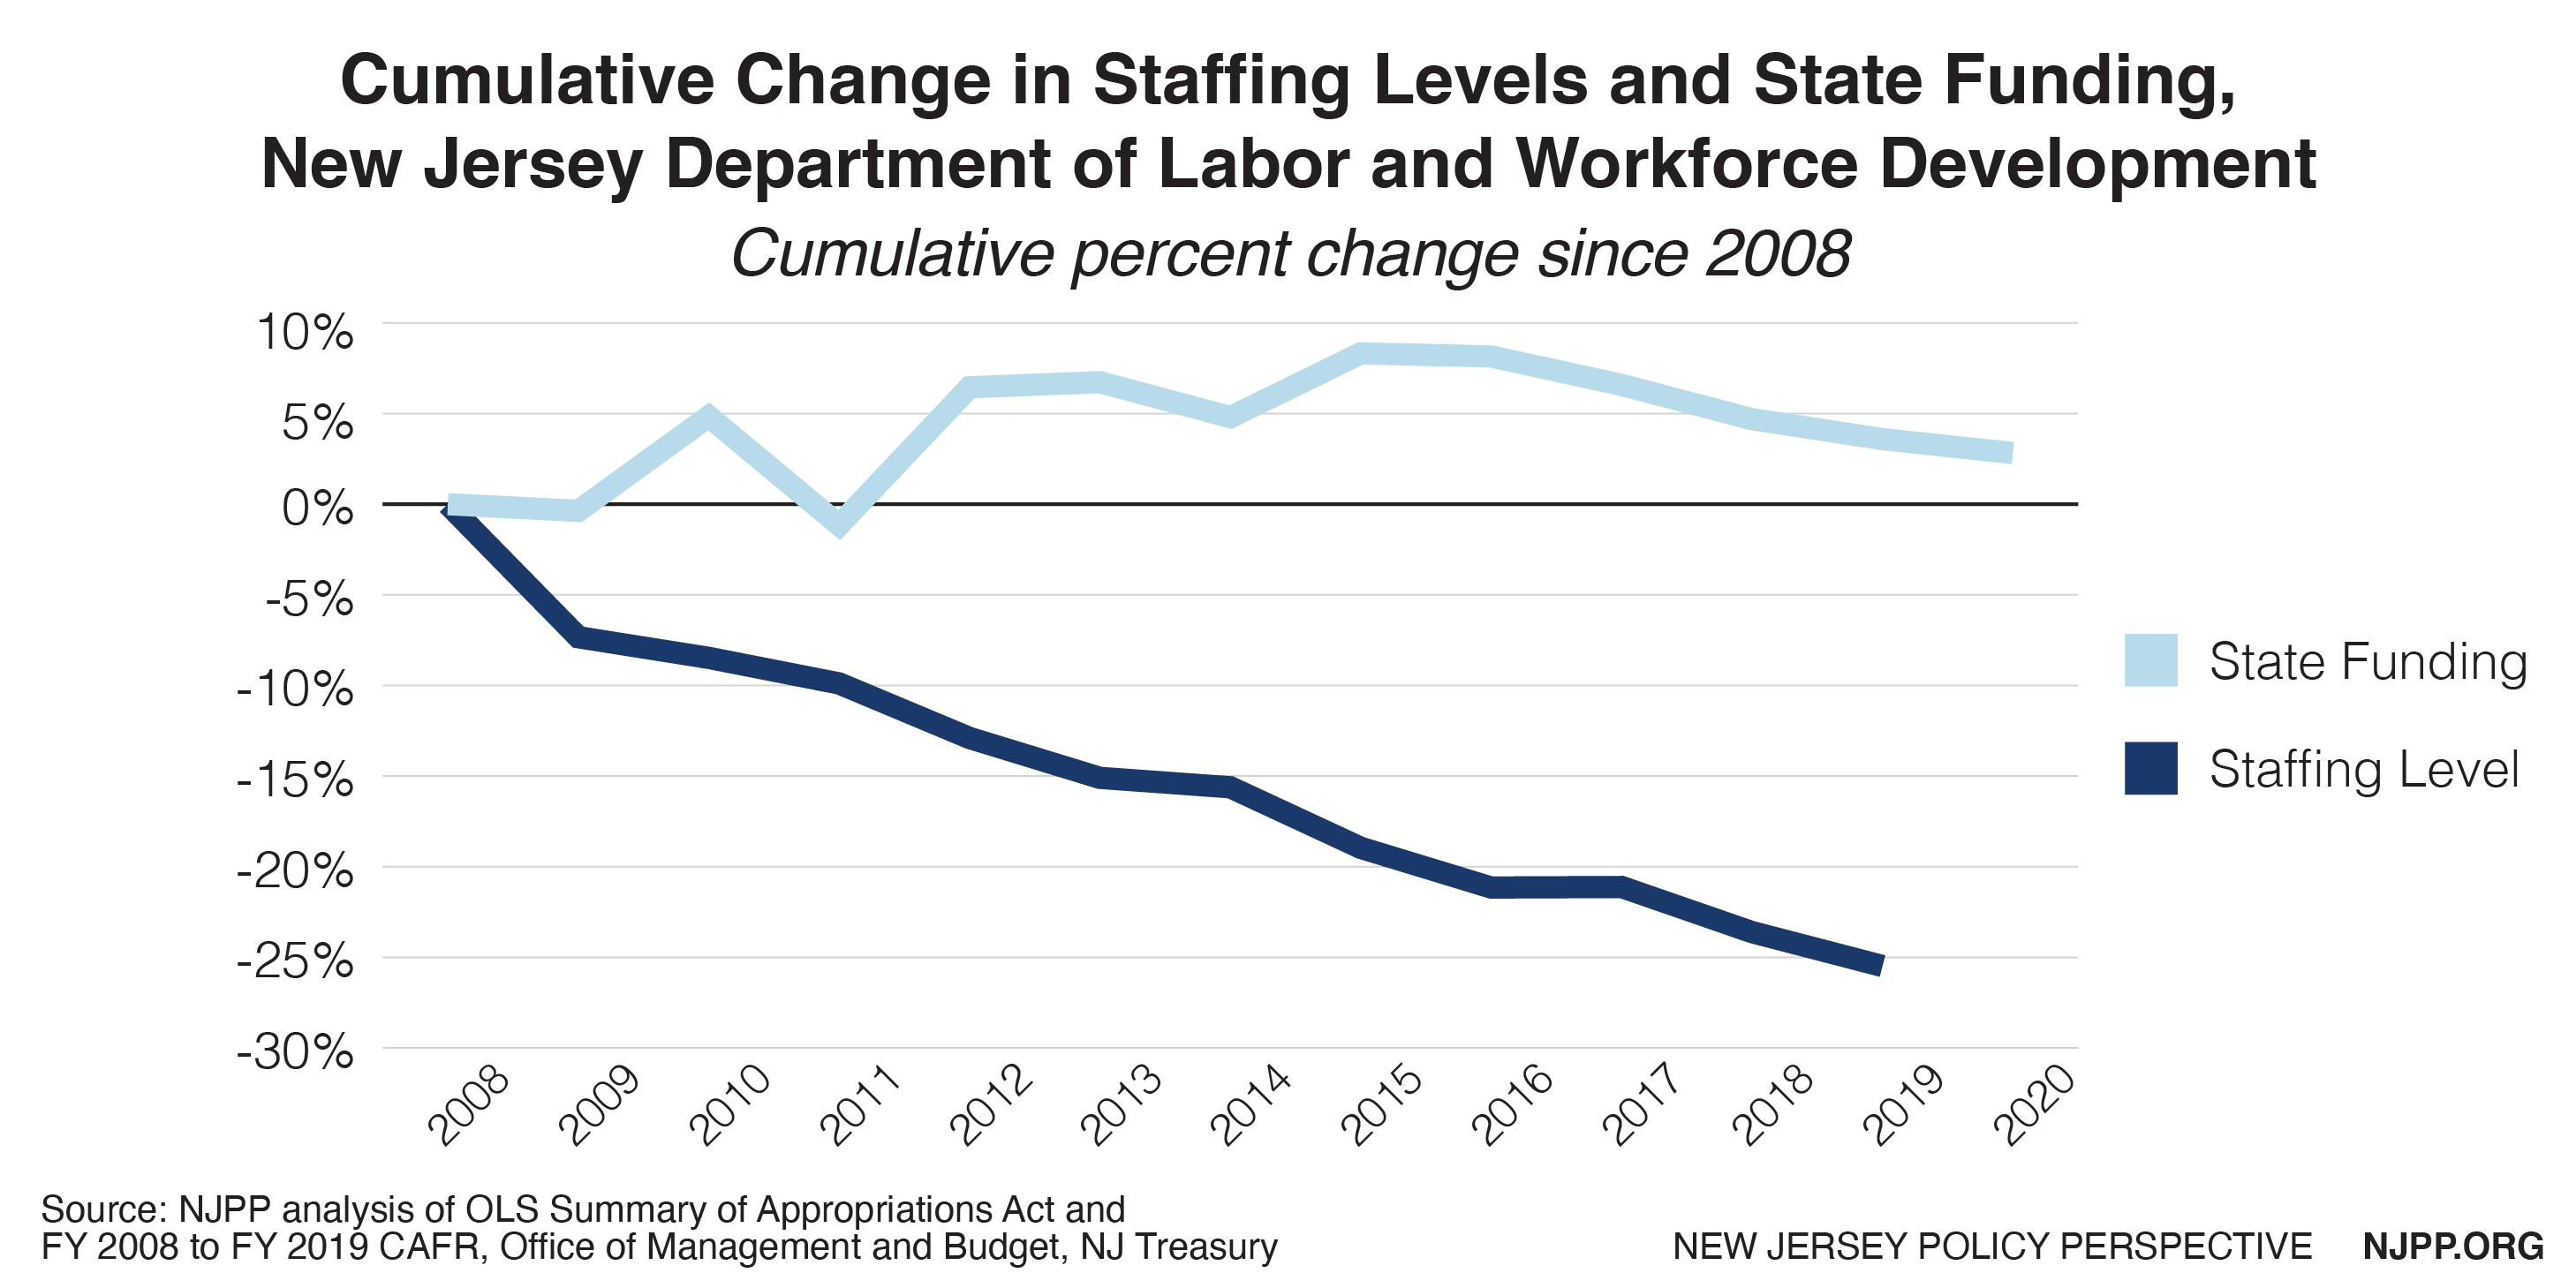
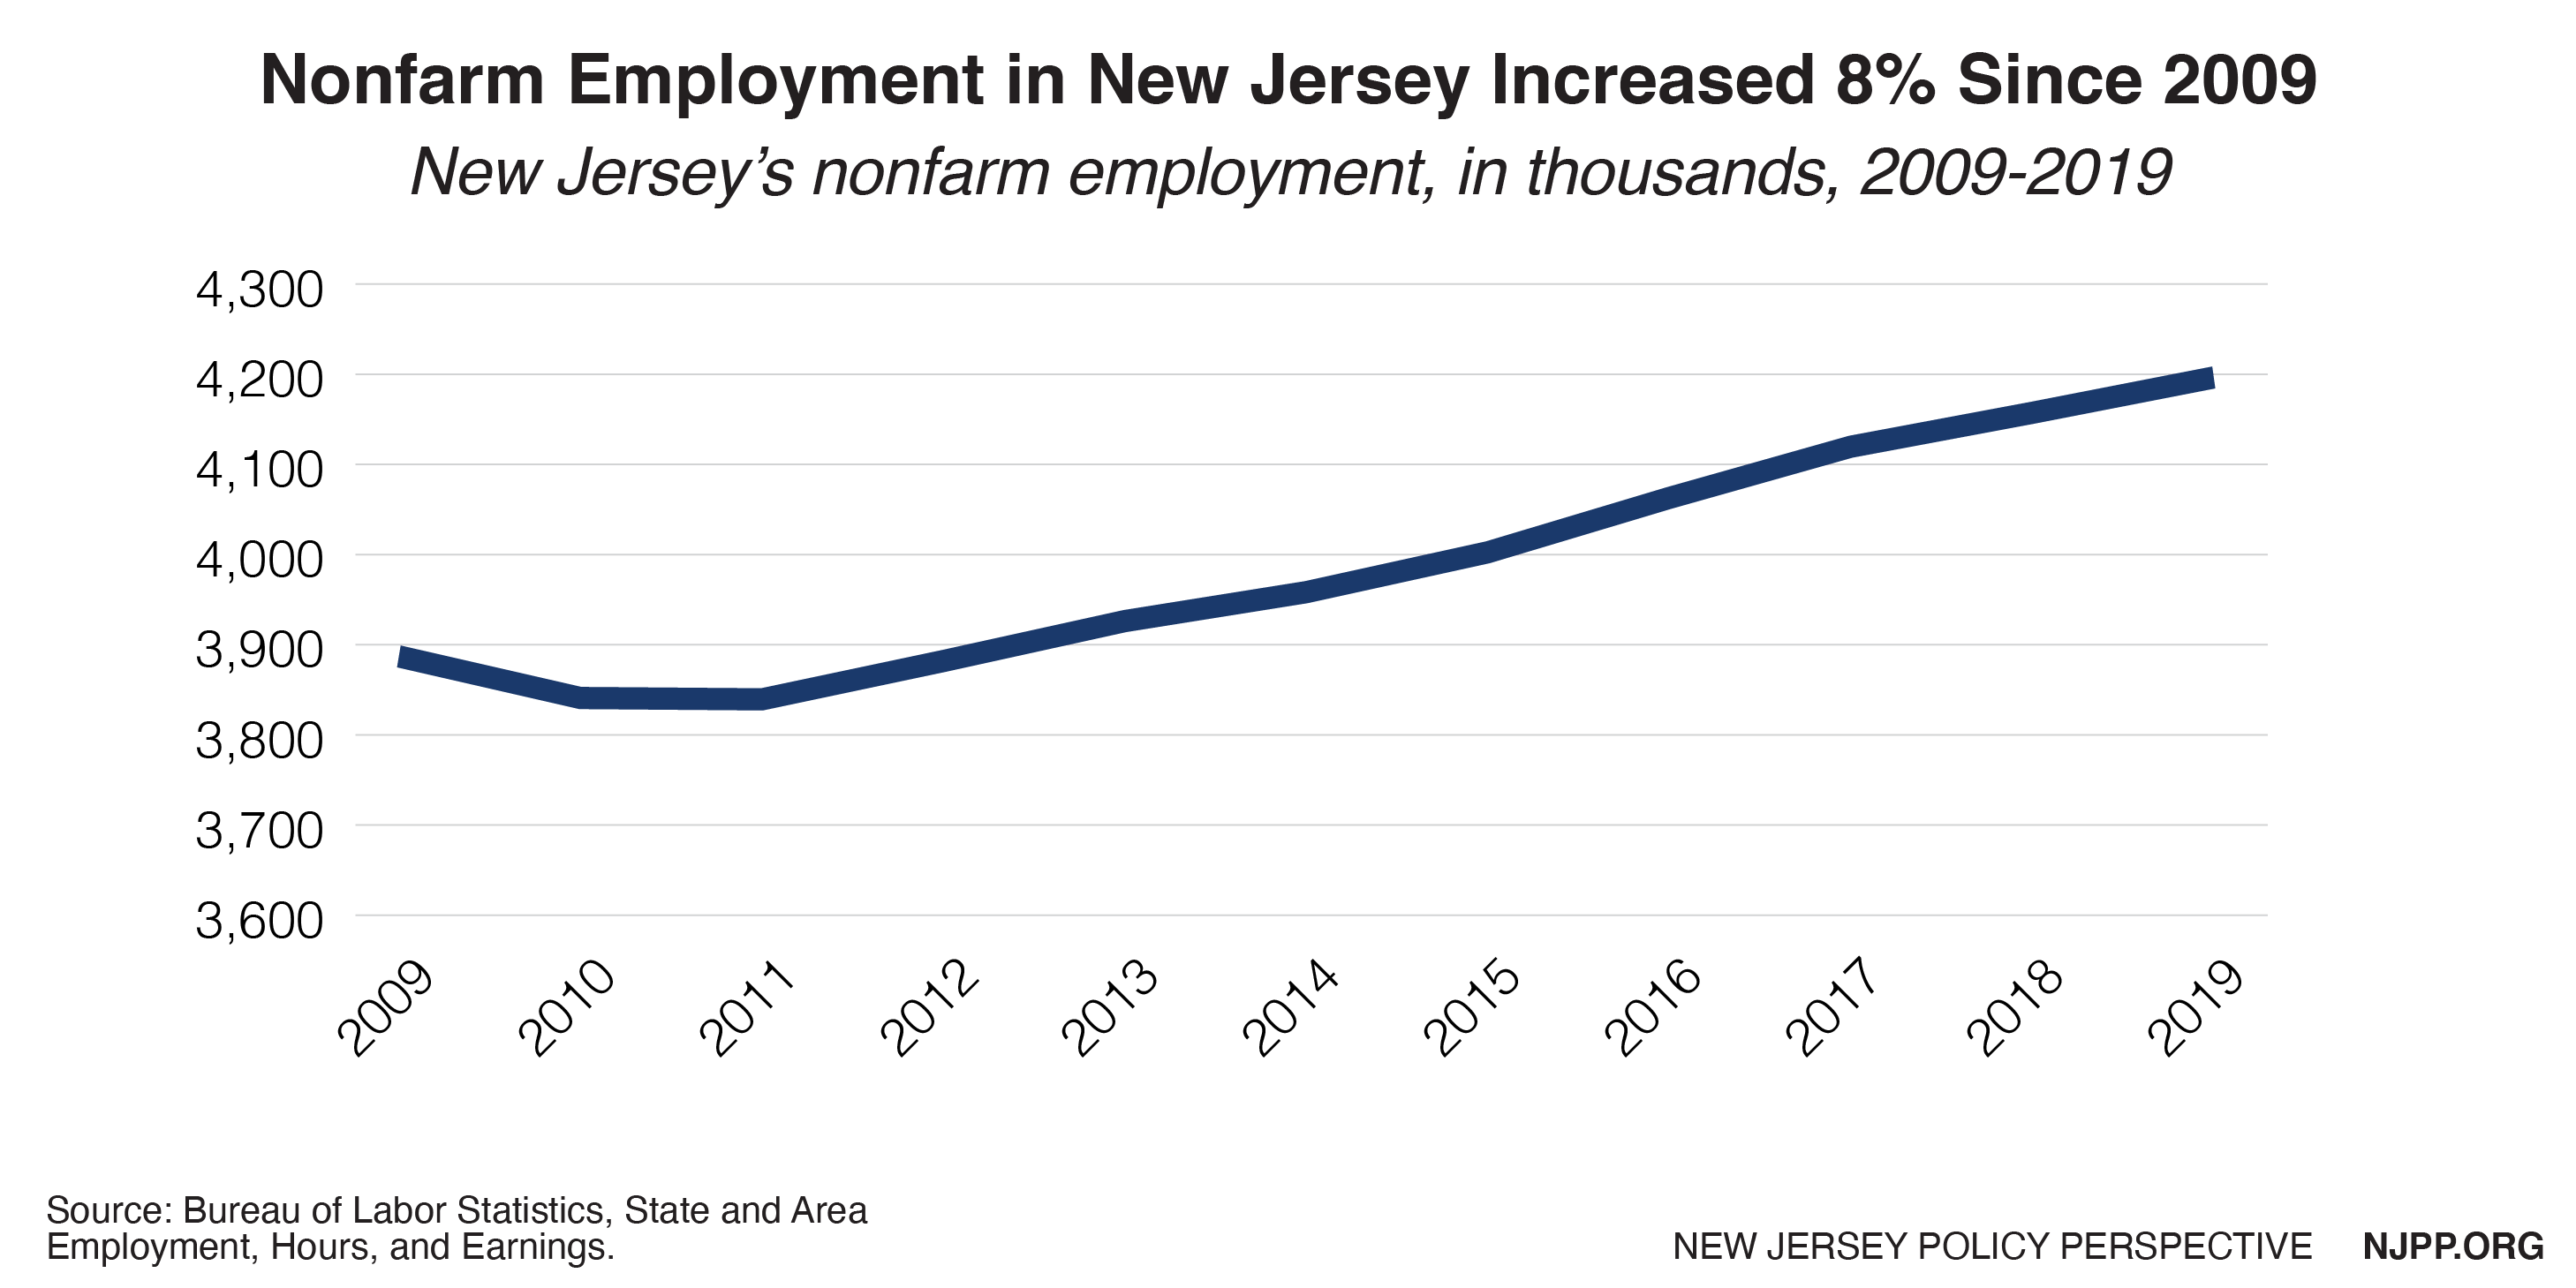
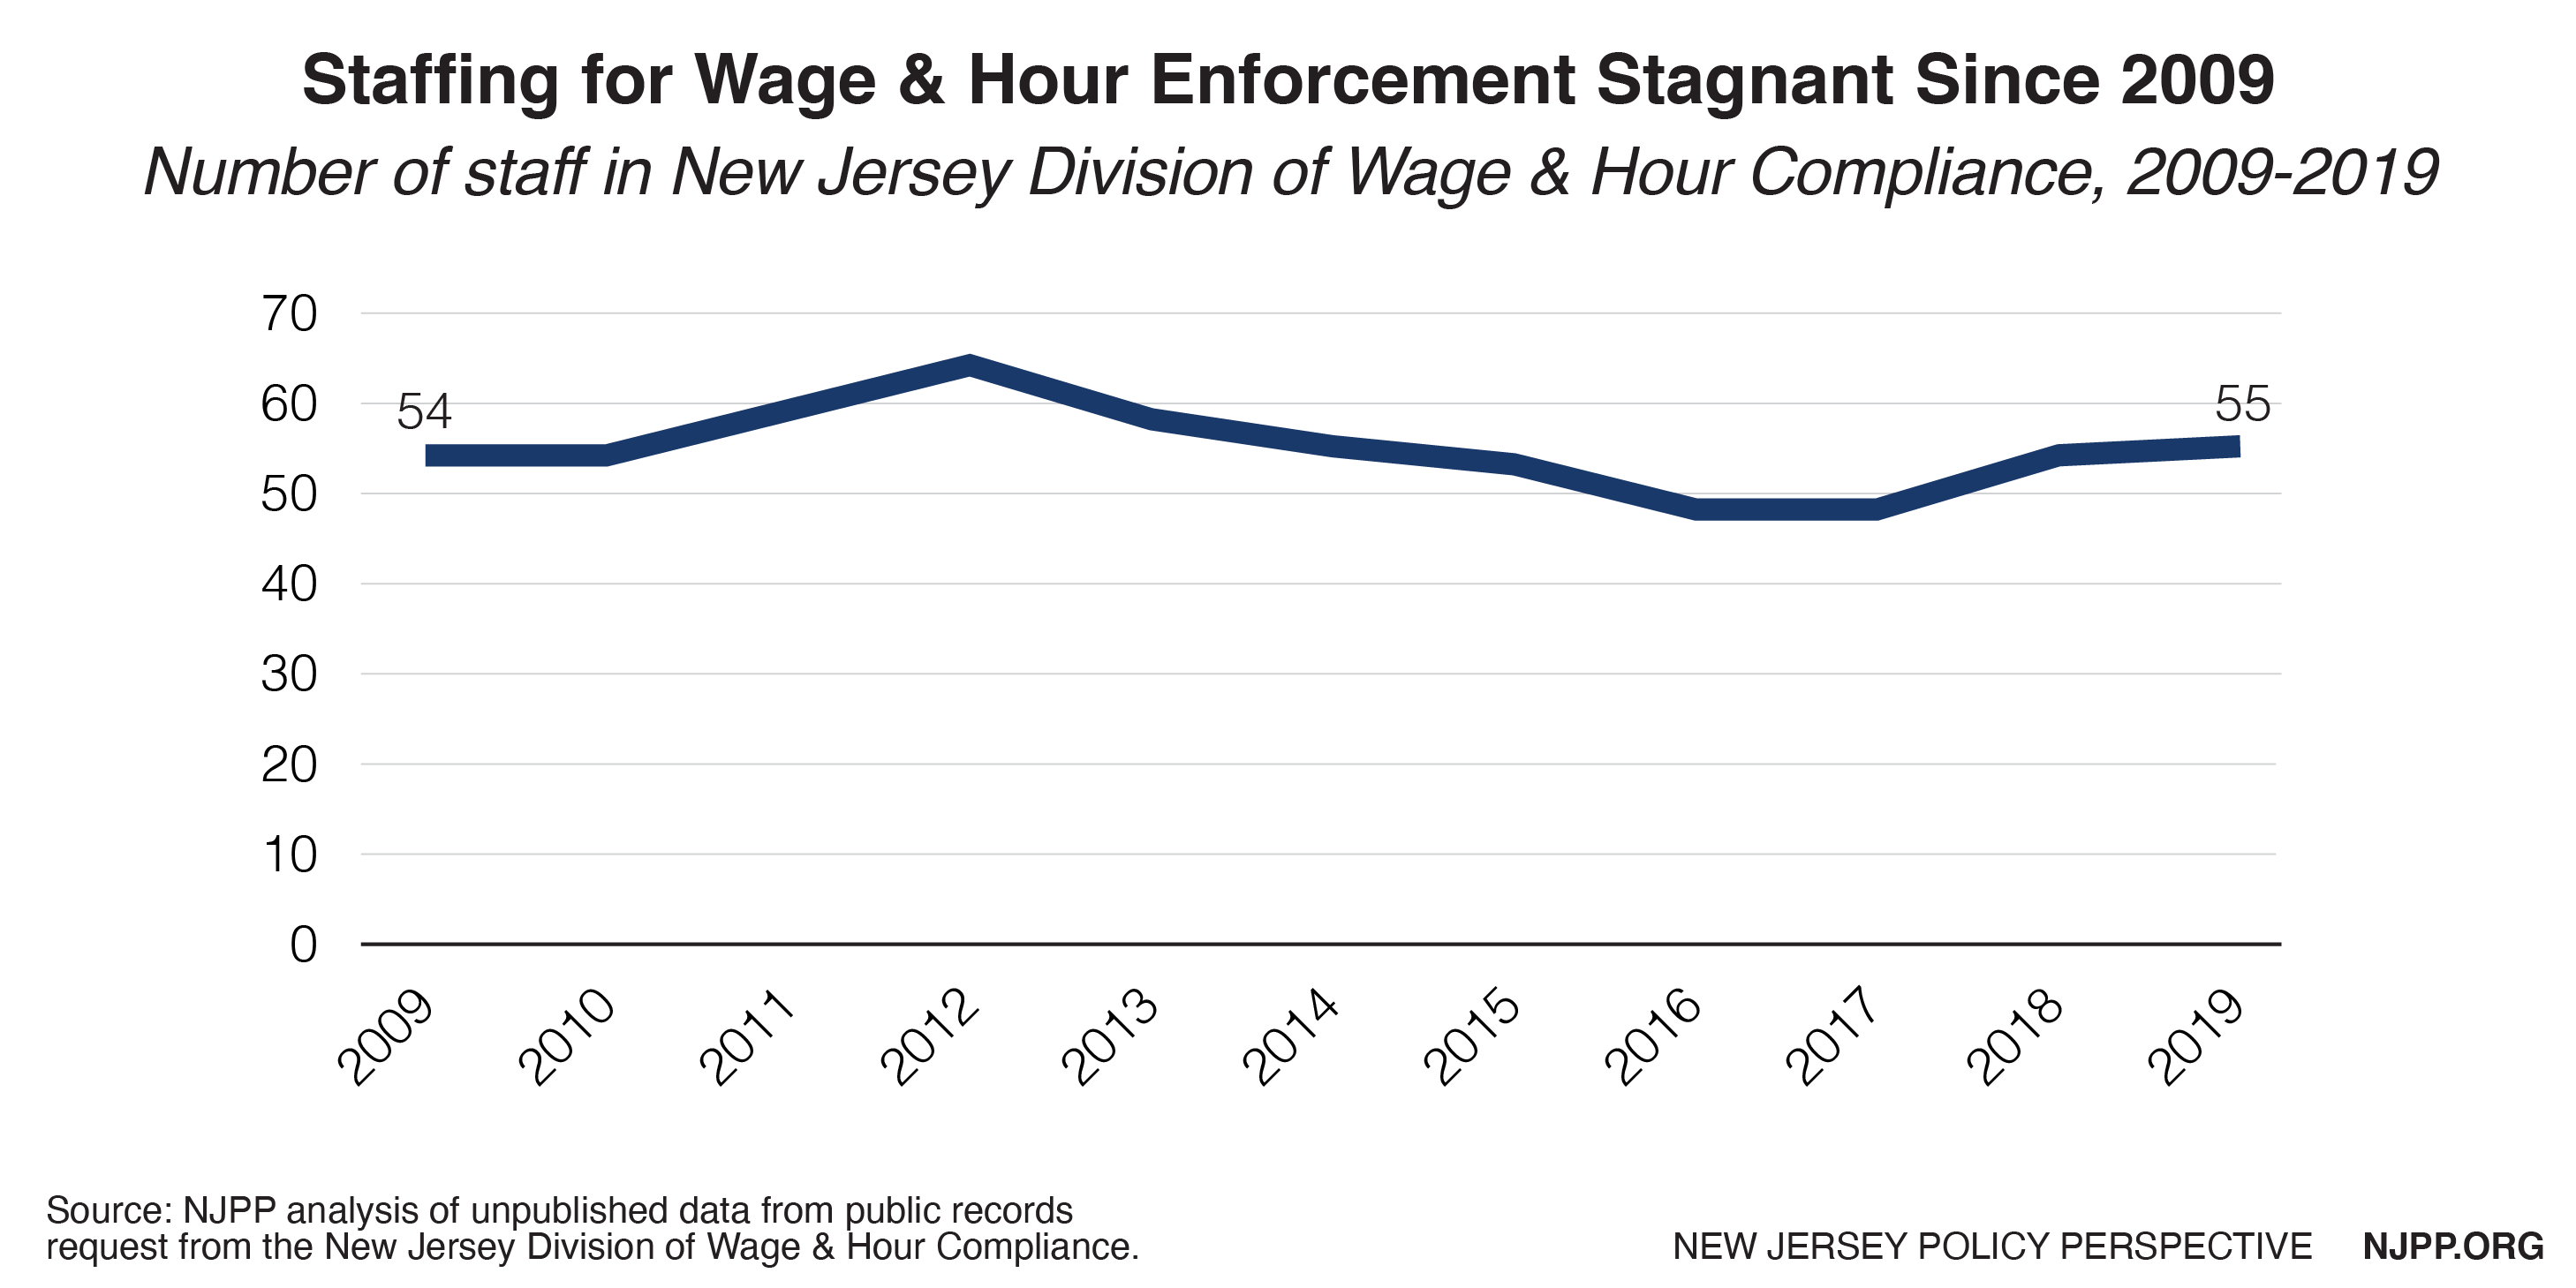
While New Jersey has recently taken steps to strengthen the rights of workers, these protections can only be effective with proper enforcement. In New Jersey, the Division of Wage and Hour Compliance within the Department of Labor and Workforce Development is the primary agency charged with protecting workers by enforcing labor laws.[15]However, a lack of resources in this division hampers enforcement capacity and threatens workers’ rights. While the state’s workforce has increased by 8 percent since 2009, enforcement staff for worker rights protections has not kept pace. Further, workforce standards appropriations have declined by 24 percent. Overall, enforcement funding per worker has declined by 26 percent since 2009, adjusting for inflation. During a pandemic, it is especially important that the state invest adequate resources into enforcing public health and workplace safety laws.
How New Jersey Can Honor Workers and Improve Economic Security
Amid a global pandemic, it is more important than ever to support our workers and those who have lost income. Several policies and programs that would improve safety and wellbeing of workers across the state have already been proposed. Strengthening and clarifying protections and supports for workers will, by extension, will promote the wellbeing of workers’ families and the general public, improving the state’s response to the COVID-19 crisis overall.
Protect Worker Safety
Workers who face unsafe conditions have little recourse and are often met with the difficult decision of risking their income or jeopardizing their health and safety. In the absence of adequate federal mandates, it is critical that the state government provide clear guidelines and strong enforcement to ensure safety in the workplace. In circumstances where adequate safety precautions are not taken, safeguards should be in place to prevent income loss or retaliation against workers. Lawmakers are currently considering several bills that would clarify and improve worker protections during and beyond the COVID-19 pandemic.
Emergency Paid Sick Days (S2453/A4209)
Under current rules, New Jersey employers are not required to allow employees to accrue, use, or carry forward more than 40 hours of earned sick leave in a benefit year. [16] Five days of sick leave is often inadequate, particularly during a public health emergency where workers may need additional sick days to recover from an illness, isolate to prevent spread, or care for a loved one. As a result, many workers are at risk of compromising their own health, or the health of their families and coworkers, to ensure their economic security. By strengthening the ability of workers to use earned sick leave when they need it, lawmakers can better support the health and wellbeing of all New Jersey residents.
Right to Refuse Unsafe Work (A4268)
This proposal would establish a set of standards that employers must follow to ensure that worker health and safety concerns are addressed without fear of retaliation or loss of income. A4628 would also direct the New Jersey Department of Labor to develop a mechanism for identifying and addressing complaints quickly and effectively, including the establishment of a 24/7 hotline.
Good Cause/Right to First Refusal (S2454/A4153)
In most cases, workers who leave a job voluntarily are only eligible for unemployment insurance benefits if their reason for leaving is both directly related to the job and so compelling that it is clear that the worker had no choice but to quit, which is known as “good cause connected with work.”[17] S2454/A4153 would reduce barriers to unemployment insurance by clarifying that workers have the right to receive unemployment benefits under “good cause” if they leave a position conditions that jeopardize health or safety. This proposal would also strengthen worker protections by requiring employers who laid off staff during the public health emergency give those employees right of first refusal for subsequent openings for which they are qualified.
Farmworker Epidemic Health and Safety Act (S2602/A4404)
Farmworkers face unique vulnerabilities to COVID-19 given the nature of the agriculture industry. Nevertheless, the health and safety of these workers are often overlooked, putting them at risk of illness. By ensuring that employers cooperate with the recommended pandemic health and safety protections for farmworkers — including mandating COVID-19 testing, inspecting work and living spaces to ensure compliance with health and safety guidance, and creating mechanisms for informing workers and employers about their rights and responsibilities — lawmakers can better protect the workers who make New Jersey the Garden State.
Executive Order for Pandemic Protections for Essential Workers
In addition to the bills outlined above, an executive order proposed by labor and immigrants’ rights advocates would create new mechanisms for addressing violations of public health and worker safety laws. This executive order would 1) direct the New Jersey Department of Labor to establish a 24-hour “worker rights protections” hotline, 2) deputize COVID-19 safety liaisons to resolve COVID-19 disputes, 3) require essential employers to provide all essential workers with notice of their pandemic protections, 4) mandate training for essential workers and essential employers, and 5) strengthen enforcement of pandemic protection violations. This proposal would protect public health, promote safety, and boost workers’ rights.
Strengthen the Social Safety Net
As more workers face economic insecurity, it is critical that New Jersey fully fund, and remove barriers to, safety net programs, including tax credits targeted to low- and moderate- income households that help New Jerseyans pay for basic needs like food, housing, and childcare. Coupled with a strong minimum wage, strengthening tax credits for workers would better support New Jersey’s households dealing with the effects of unequal and slow wage growth, as well as support the state’s overall economy as we recover from the effects of COVID-19. In addition, ensuring that all workers have access to resources when they lose income is critical to worker wellbeing and economic security.
Earned Income Tax Credit (EITC)
The federal EITC helps low- to moderate-income families make ends meet by boosting their after-tax earnings. New Jersey has its own version of the credit, the NJ EITC, which supplements the federal benefit with a 40 percent match of the federal credit amount.[18] The EITC has been associated with improved health outcomes, educational achievements, and lifetime earning potential.[19] Recipients tend to use the credit to meet short- and medium- terms needs, such as transportation and household supplies, which increases economic activity. The EITC’s narrow eligibility requirements, however, currently exclude many New Jersey workers. The New Jersey Legislature is considering several bills that would address barriers to the state EITC. These bills would:
- Expand eligibility to childless workers ages 18 to 24 years old (A838/S835),
- Increase the credit amount from 40 percent to 50 percent of the federal credit over two years (in 2021 and 2022) for all recipients (A841/S836),
- Increase the credit amount to 100 percent for all childless workers (A839/S765),
- Enable qualifying relatives to be treated as qualifying children (A840/S764), and
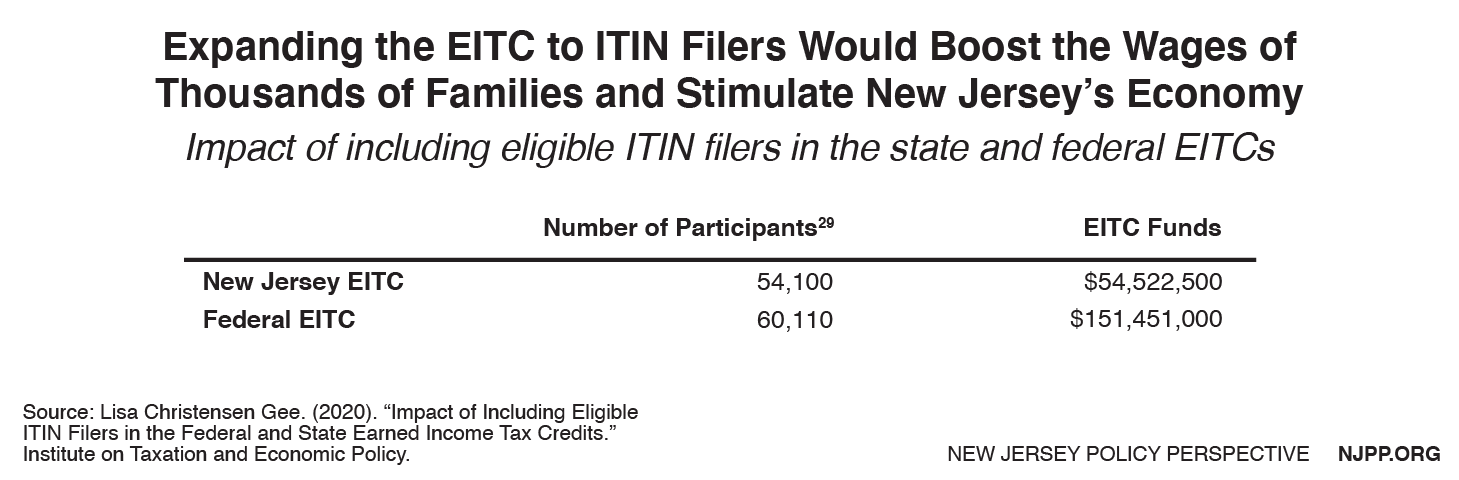
- Expand the EITC to immigrants who file taxes using an Individual Taxpayer Identification Number (A4229/S2194).
By reducing barriers to the EITC and increasing the credit amount, the program could be a stronger tool for addressing economic insecurity.
Child and Dependent Care Credit
The Child and Dependent Care Credit is a federal tax benefit that helps families cover the costs of caring for qualifying children and adult dependents.[20] In 2018, New Jersey created a state version of the Child and Dependent Care Tax Credit, which is calculated as a percentage of the taxpayer’s federal credit.[21] This credit reduces the amount of New Jersey Gross Income Tax owed; however, it does not result in a refund if no taxes are owed. By making the Child and Dependent Care Tax Credit fully refundable, families could receive a credit regardless of their tax liability, which would enable more children in families with little or no income to benefit from the program.
Address Barriers to Income Replacement and Pandemic Relief
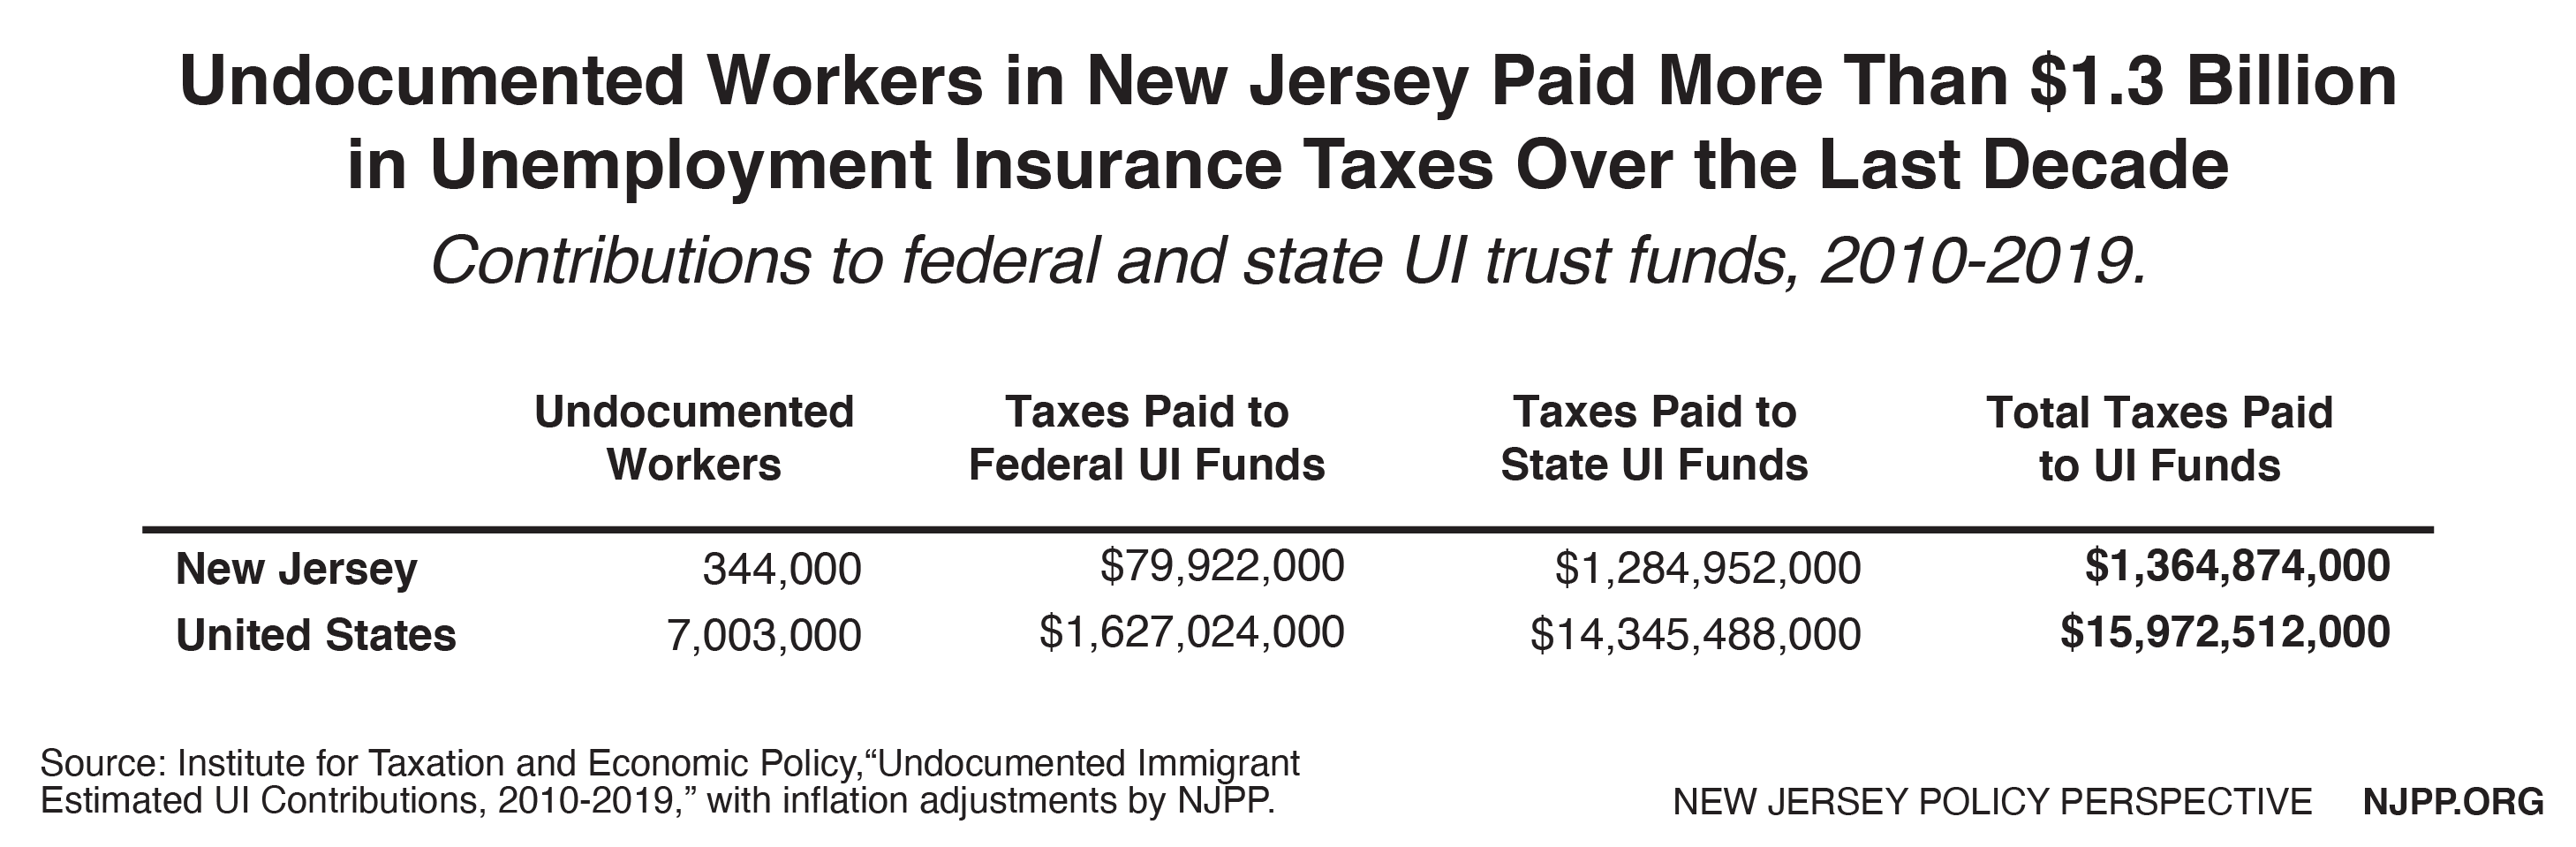
Most New Jersey residents who have been affected by the pandemic have received some relief through federal stimulus checks, unemployment insurance, and other public programs. However, several groups of New Jerseyans have been excluded from many forms of economic relief, including undocumented immigrants and their families, people leaving incarceration, and certain people working in the cash economy. Barriers related to immigration status, for example, have excluded an estimated 686,000 state residents from the CARES Act federal pandemic stimulus checks.[22] New Jersey lawmakers are currently considering a bill that would provide a one-time payment to certain households who were excluded from federal stimulus payments and filed taxes using an Individual Taxpayer Identification Number (S2480/A4171). By providing emergency relief as well as long-term income replacement support to New Jersey residents whose earnings have been impacted by the pandemic, the state can take a step toward a more robust and even recovery from the current crisis.
End Notes
[1] Gould, Elisa and Valerie Wilson. 2020. “Black workers face two of the most lethal preexisting conditions for coronavirus—racism and economic inequality.” Economic Policy Institute. https://www.epi.org/publication/black-workers-covid/; Gelatt, Julie. 2020. “Immigrant Workers: Vital to the U.S. COVID-19 Response, Disproportionately Vulnerable.” Migration Policy Institute. https://www.migrationpolicy.org/research/immigrant-workers-us-covid-19-response
[2] New Jersey Department of Labor. January 20, 2020. “Governor Murphy Signs Sweeping Legislative Package to Combat Worker Misclassification and Exploitation” https://www.nj.gov/labor/lwdhome/press/2020/20200120_missclass.shtml
[3] Economic Policy Institute’s analysis of the Current Population Survey. 2020. “Wages by decile.”
[4] U.S. Department of Labor. “Changes in Basic Minimum Wages in Non-Farm Employment Under State Law: Selected Years 1968 to 2019.” https://www.dol.gov/agencies/whd/state/minimum-wage/history
[5] Rodriguez, Nicole. 2019. “New Jersey’s Minimum Wage Rises to $11.00.” New Jersey Policy Perspective. https://www.njpp.org/blog/new-jerseys-minimum-wage-rises-to-11-00
[6] Economic Policy Institute’s analysis of the Current Population Survey Outgoing Rotation Group. 2020. “Wage by Gender.”
[7] American Community Survey. 2018. Table S0201: 1-Year Estimates Selected Population Profiles.
[8] https://www.nj.gov/labor/lwdhome/press/2020/20200827_paymentsupdate.shtml
[9] New Jersey Department of Labor. 2020, August 7. “Weekly Unemployment Compensation Plummets After Federal Supplement Expires.” https://www.nj.gov/labor/lwdhome/press/2020/20200827_paymentsupdate.shtml
[10] Williams, Jhacova. 2020. “State unemployment by race and ethnicity.” Economic Policy Institute. https://www.epi.org/indicators/state-unemployment-race-ethnicity/
[11] U.S. Census Bureau. 2020. Week 12 Household Pulse Survey: July 16 – July 21. “Employment Table 1. Experienced and Expected Loss of Employment Income by Select Characteristics: New Jersey.” https://www.census.gov/data/tables/2020/demo/hhp/hhp12.html
[12] New Jersey Department of Health. 2020, September 2. NJ COVID-19 Long Term Care Facilities Dashboard. https://www.nj.gov/health/cd/topics/covid2019_dashboard.shtml
[13] Rho, Hye Jin, Hayley Brown, and Shawn Fremstad. 2020. “A Basic Demographic Profile of Workers in Frontline Industries.” https://cepr.net/a-basic-demographic-profile-of-workers-in-frontline-industries/
[14] Rho, Hye Jin, Hayley Brown, and Shawn Fremstad. 2020. “A Basic Demographic Profile of Workers in Frontline Industries.” https://cepr.net/a-basic-demographic-profile-of-workers-in-frontline-industries/
[15] District attorneys, Attorney Generals, and the U.S. Department of Labor also enforce workforce protections.
[16] New Jersey Department of Labor. “NJ State Wage and Hour Laws and Regulations.” https://nj.gov/labor/wagehour/lawregs/nj_state_wage_and_hour_laws_and_regulations.html?_ga=2.266351949.21924739.1598861121-2059223368.1590513585#11D1
[17] New Jersey Department of Labor, Division of Unemployment Insurance. “What if you quit or were fired?”https://myunemployment.nj.gov/before/about/who/quitfired.shtml
[18] New Jersey Department of Treasury. “New Jersey Earned Income Tax Credit”. https://www.state.nj.us/treasury/taxation/eitc/eitcinfo.shtml
[19] Marr, Chuck, Chye-Ching Huang, Arloc Sherman, and Brandon Debot. 2015. “EITC and Child Tax Credit Promote Work, Reduce Poverty, and Support Children’s Development, Research Finds.” Center on Budget and Policy Priorities. https://www.cbpp.org/research/federal-tax/eitc-and-child-tax-credit-promote-work-reduce-poverty-and-support-childrens?fa=view&id=3793
[20] Internal Revenue Service. “Topic No. 602 Child and Dependent Care Credit.” https://www.irs.gov/taxtopics/tc602
[21] New Jersey Division of Taxation. “Child and Dependent Care Credit (P.L. 2018, c.45).” https://www.nj.gov/treasury/taxation/depcarecred.shtml
[22] Migration Policy Institute. 2020. “Mixed-Status Families Ineligible for CARES Act Federal Pandemic Stimulus Checks.” https://www.migrationpolicy.org/content/mixed-status-families-ineligible-pandemic-stimulus-checks
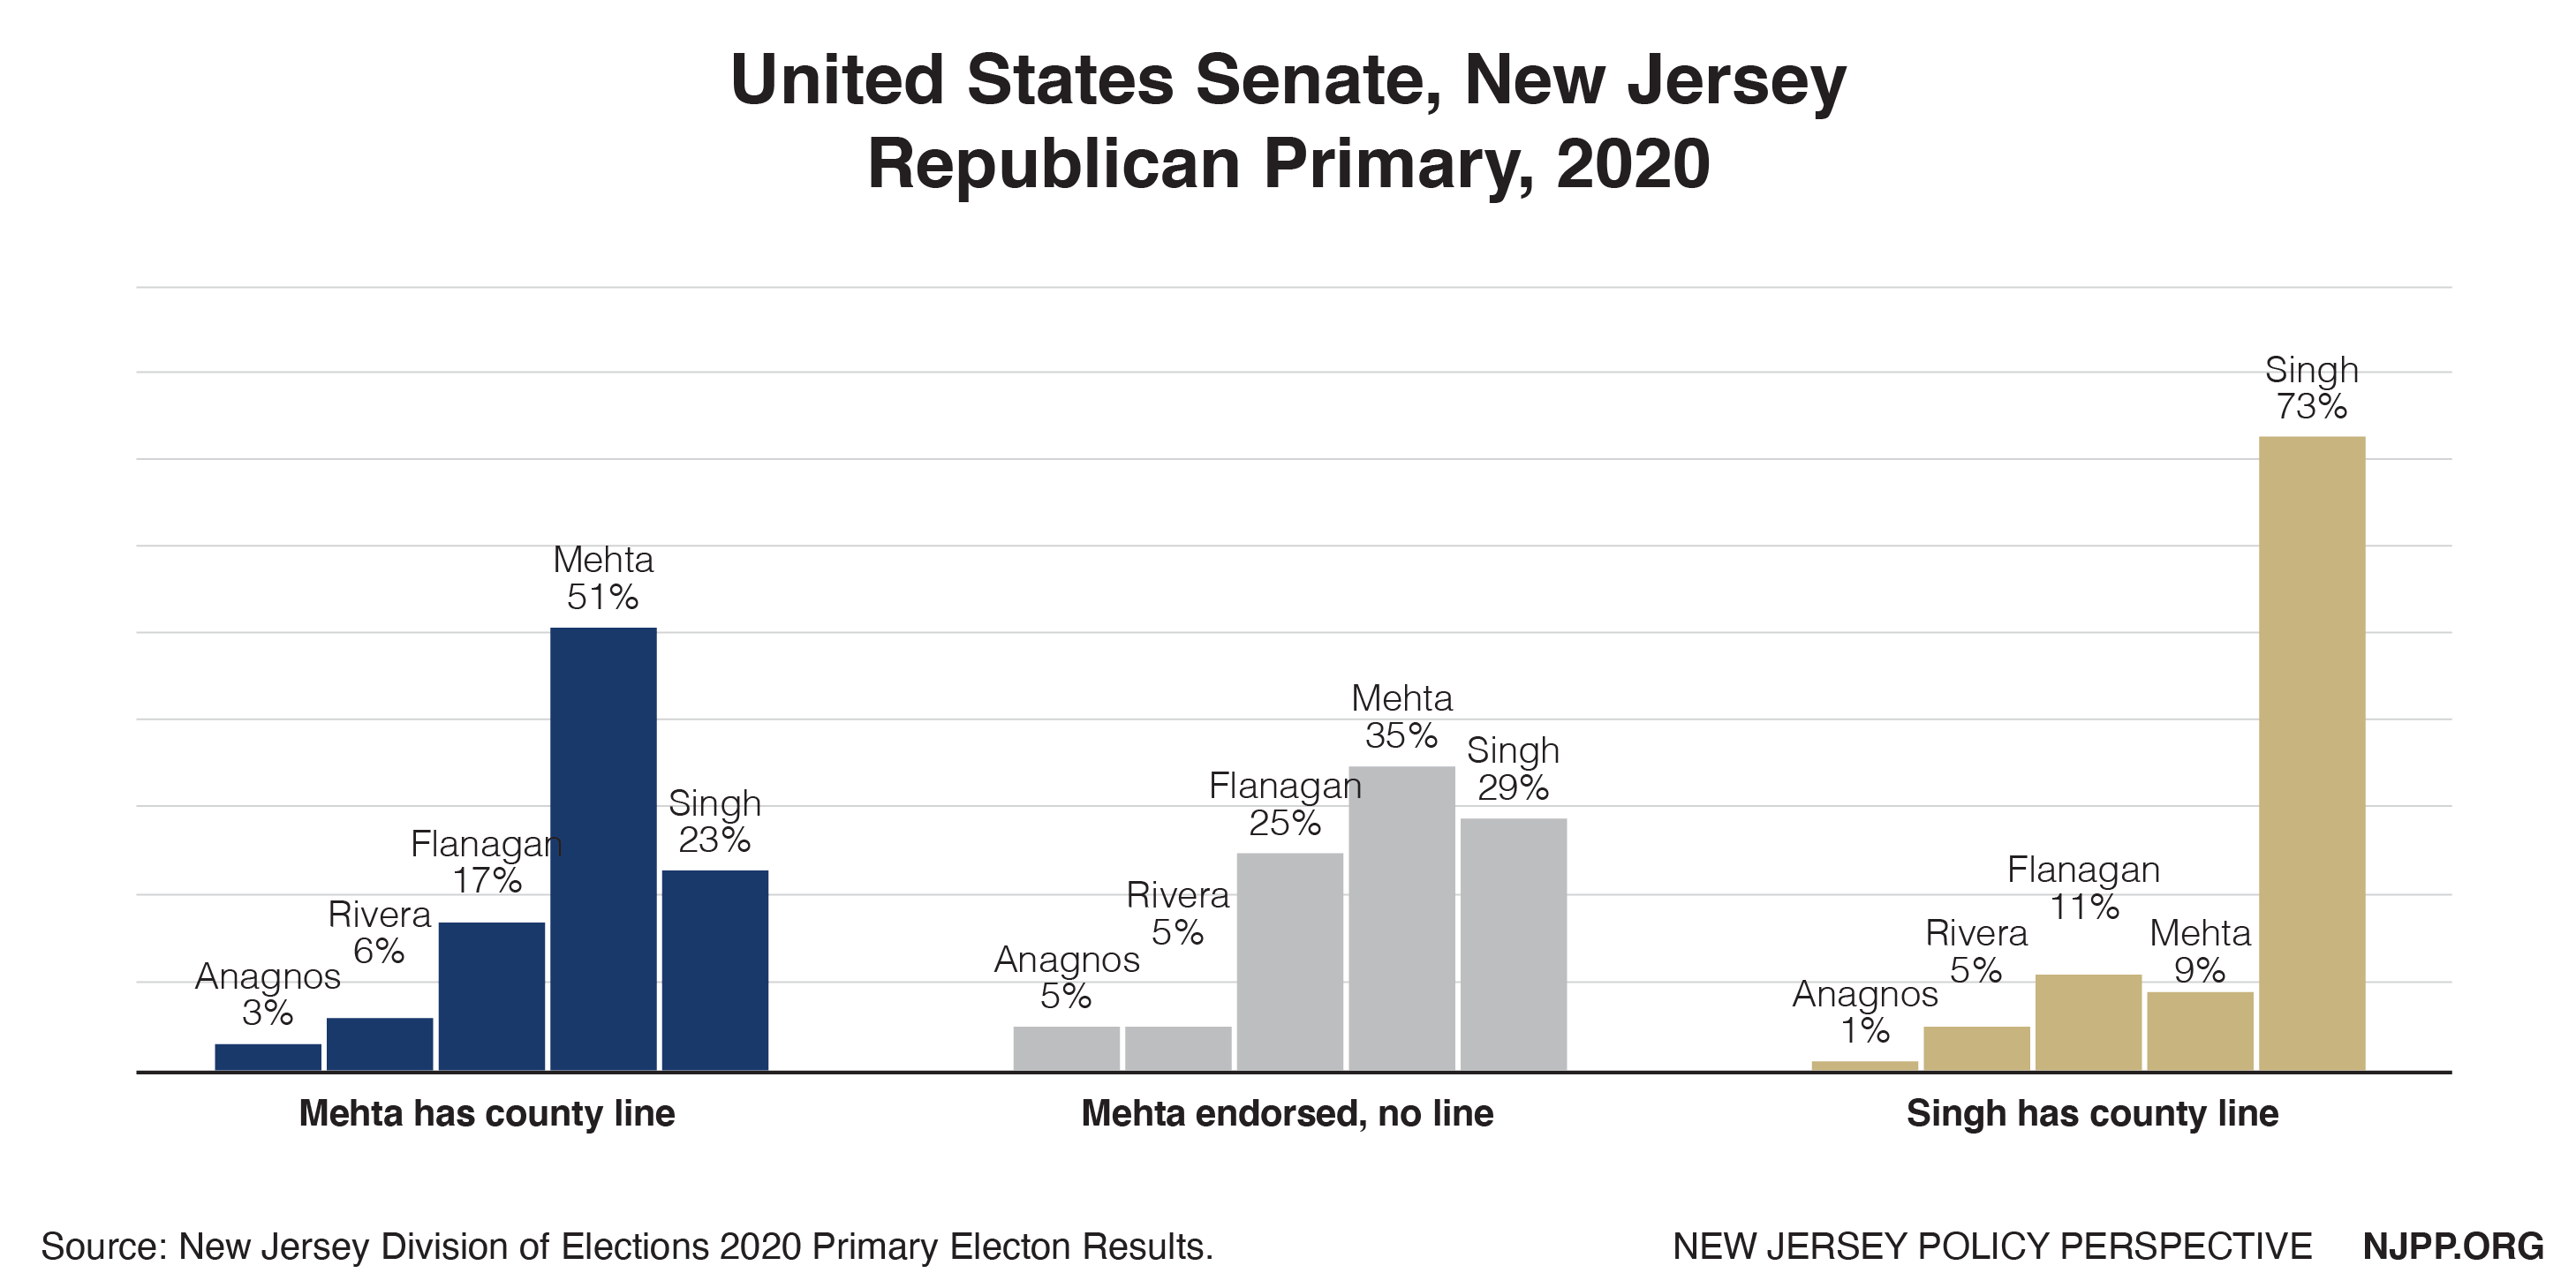
 Figure 1: Monmouth County 4th Congressional District 2020 Democratic primary ballot.
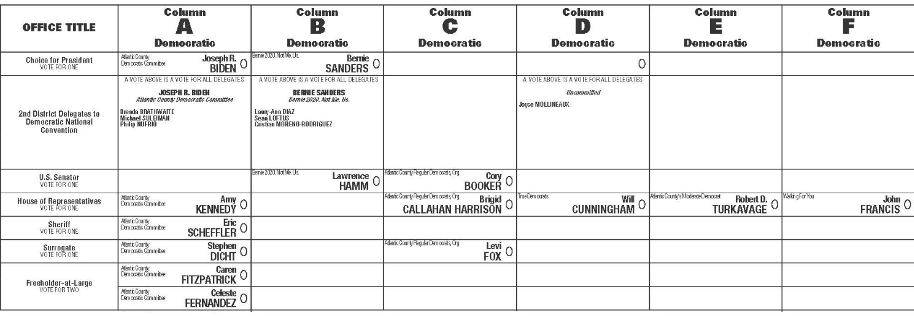 Figure 3: Atlantic County 2nd Congressional District 2020 Democratic primary ballot.
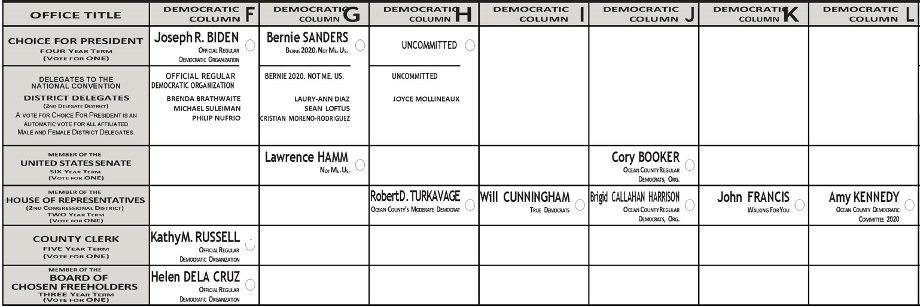 Figure 4: Ocean County 2nd Congressional District 2020 Democratic primary ballot.
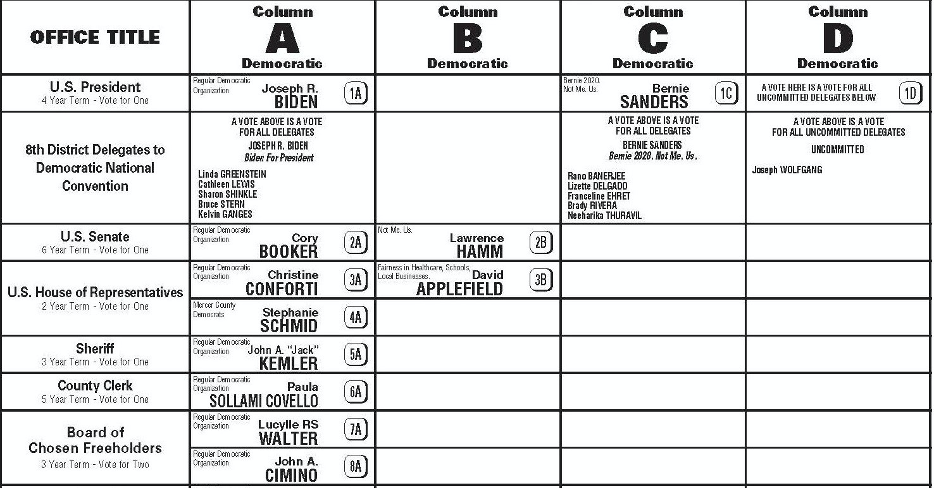 Figure 5: Mercer County 4th Congressional District 2020 Democratic primary ballot.