Roadmap to Electrifying New Jersey’s Public Bus Fleet

Introduction

New Jersey’s future prosperity depends on a transportation system that works for everyone. Over generations, communities across the Garden State have come together to support the mobility of New Jerseyans through public transit. The state’s investments in transportation have nurtured economic productivity and improved access to jobs, schools, and other opportunities. Indeed, the state would look quite different without those forward-thinking investments.

While NJ Transit’s diesel bus fleet has been an indispensable tool for so many New Jerseyans, there are significant environmental and public health costs. By electrifying the state’s public bus fleet, New Jersey can reduce the environmental and health harms that arise from the use of diesel buses, including the greenhouse gas emissions that exacerbate climate change; zero emission buses would also contribute to healthier communities, especially for people of color and those living in low-income neighborhoods.[i]Electrifying public buses also provides a reliable and cost-effective option to maintain and expand the state’s transit system through advances in electric bus technology and rapid declines in battery costs.[ii]

This report examines the important benefits of public transit, particularly for people of color and low-income populations. It then describes the environmental and public health perils of a diesel-based fleet and reviews the environmental and health benefits of electric buses. The report also provides the major costs to and long-term savings of electrifying NJ Transit’s bus fleet, as articulated within the targets of the Electric Vehicle Law (N.J.S.A. 48:25-3). Finally, the report offers funding recommendations along with recommendations for a smoother and more equitable transition from diesel to electric public buses.

Public Transit as a Public Good

Hundreds of thousands of New Jersey residents across the state use and rely on public transit on a daily basis.[iii] Transportation connects people to jobs, medical appointments, grocery stores, child care, education, and more. During Fiscal Year 2019 alone, riders took 267.3 million trips on public transit in New Jersey, with more than half of those trips, or 141.2 million, taking place on public buses.[iv]

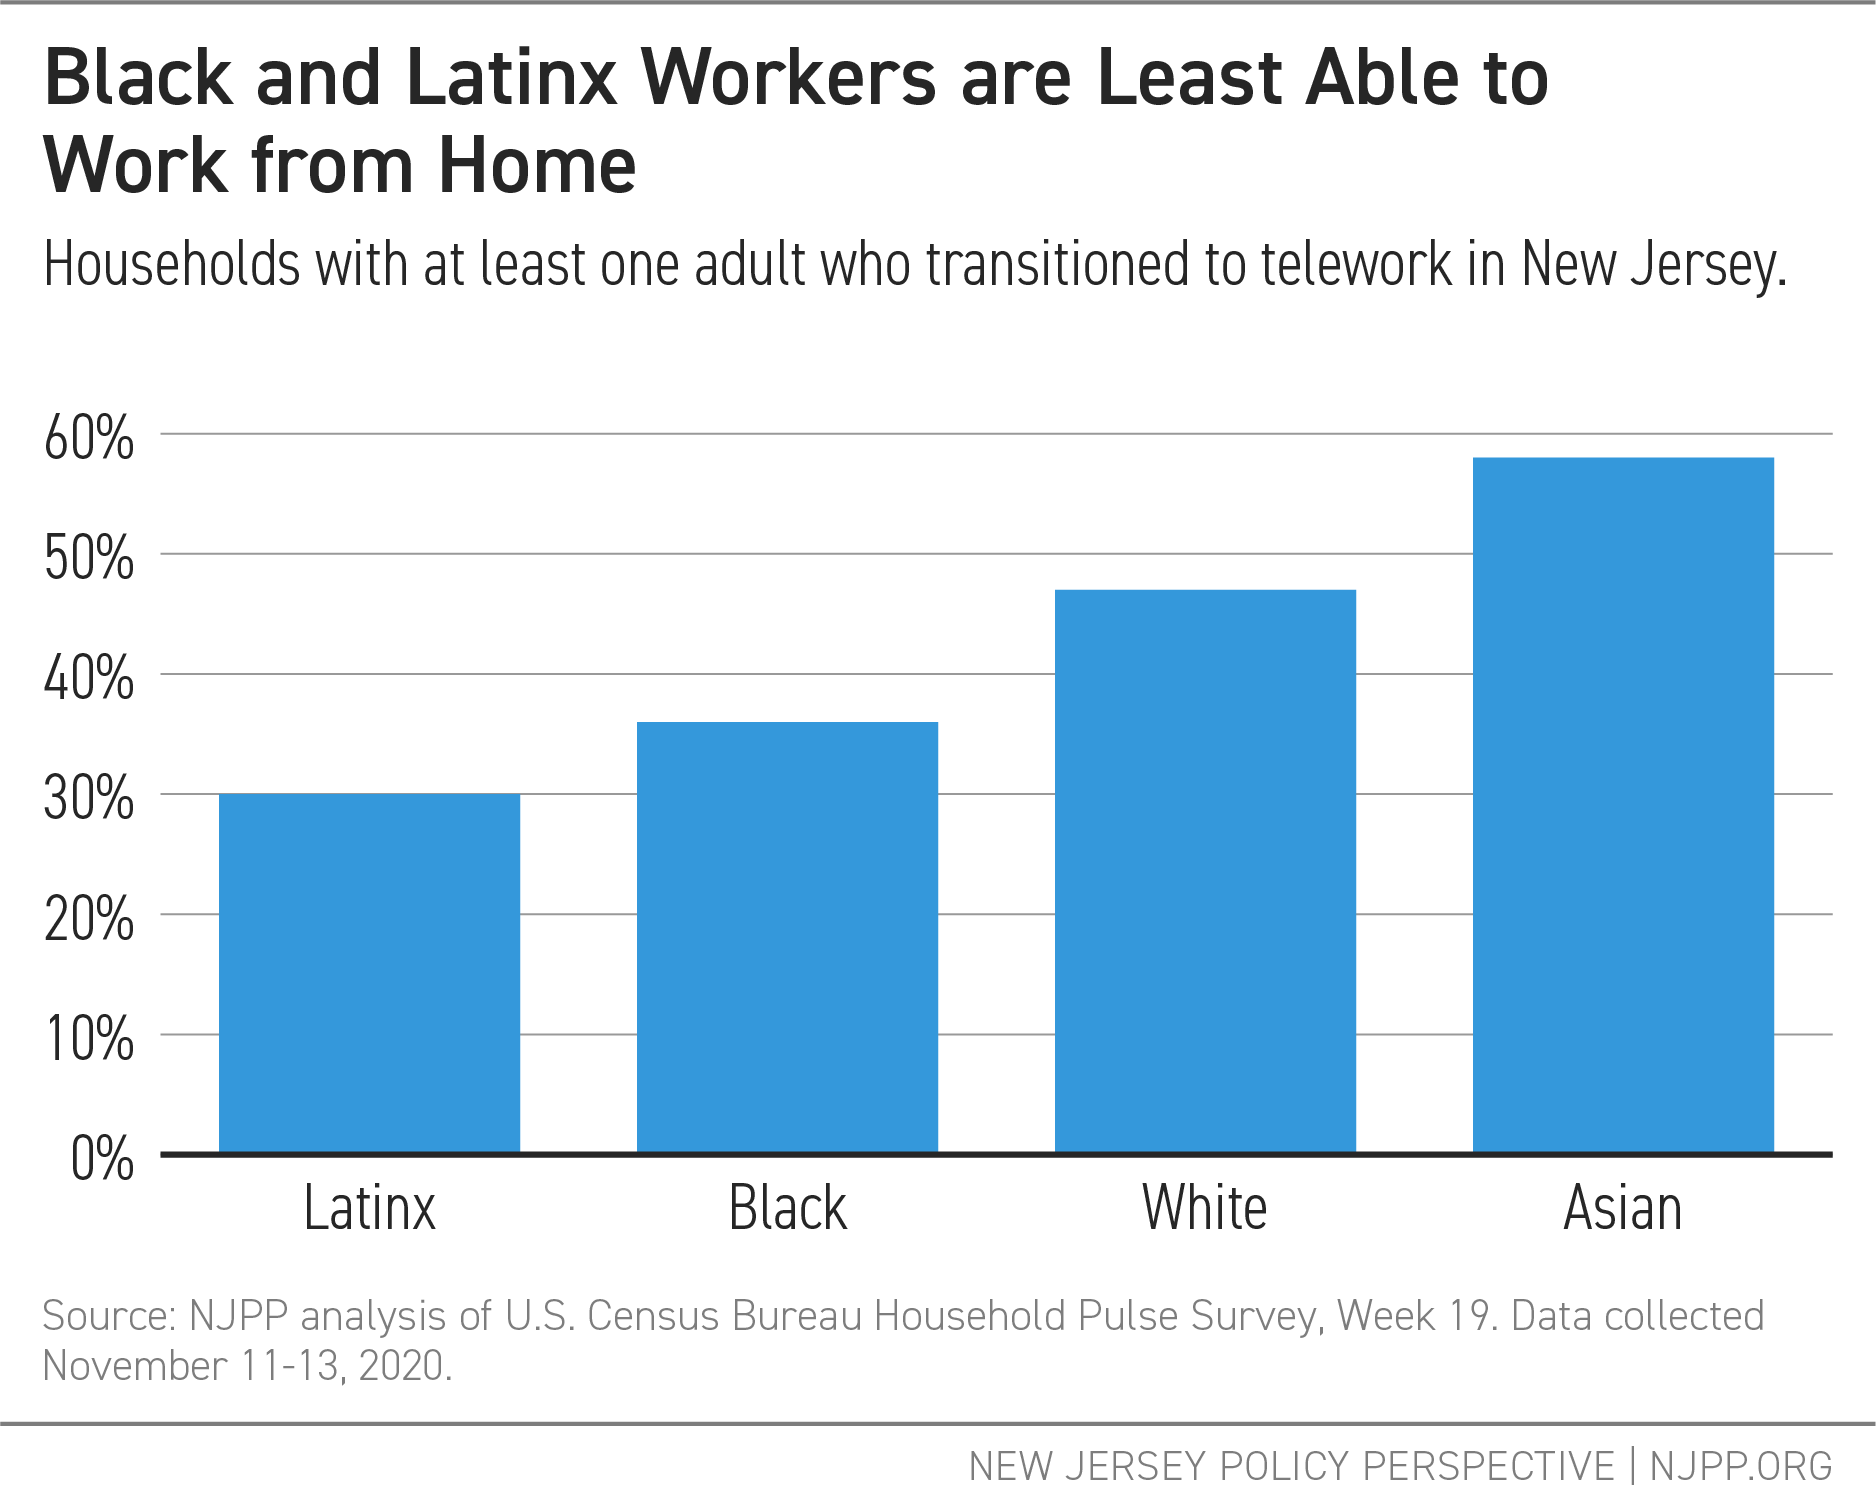
Yet, structural inequities shape — and are shaped by — transit access and use. On the one hand, low-wage jobs, low rates of car ownership, and the “digital divide” mean that some people use transit instead of working from home or driving cars to get where and what they need. For instance, households of color, particularly Black households, are less likely to have access to a vehicle as compared to their white counterparts.[v] And in cities with higher concentrations of people of color, like Jersey City and Newark, households are more likely to lack access to a vehicle compared to households in smaller cities.[vi] On the other hand, as this report discusses below in Section III, public transit, as it exists now, both highlights ー and can exacerbate ー other structural inequities, such as those in public health. Simply put, people of color disproportionately rely on public transit.

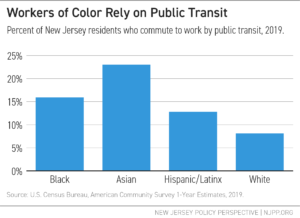
Black and Asian workers are almost two and three times as likely, respectively, as white workers to commute to work by public transit; Hispanic/Latinx workers are 1.5 times more likely. Specifically, 8.1 percent of white workers use public transit, while 15.9 percent of Black workers, 23.0 percent of Asian workers, and 12.8 percent of Hispanic/Latinx workers commute using public transit.

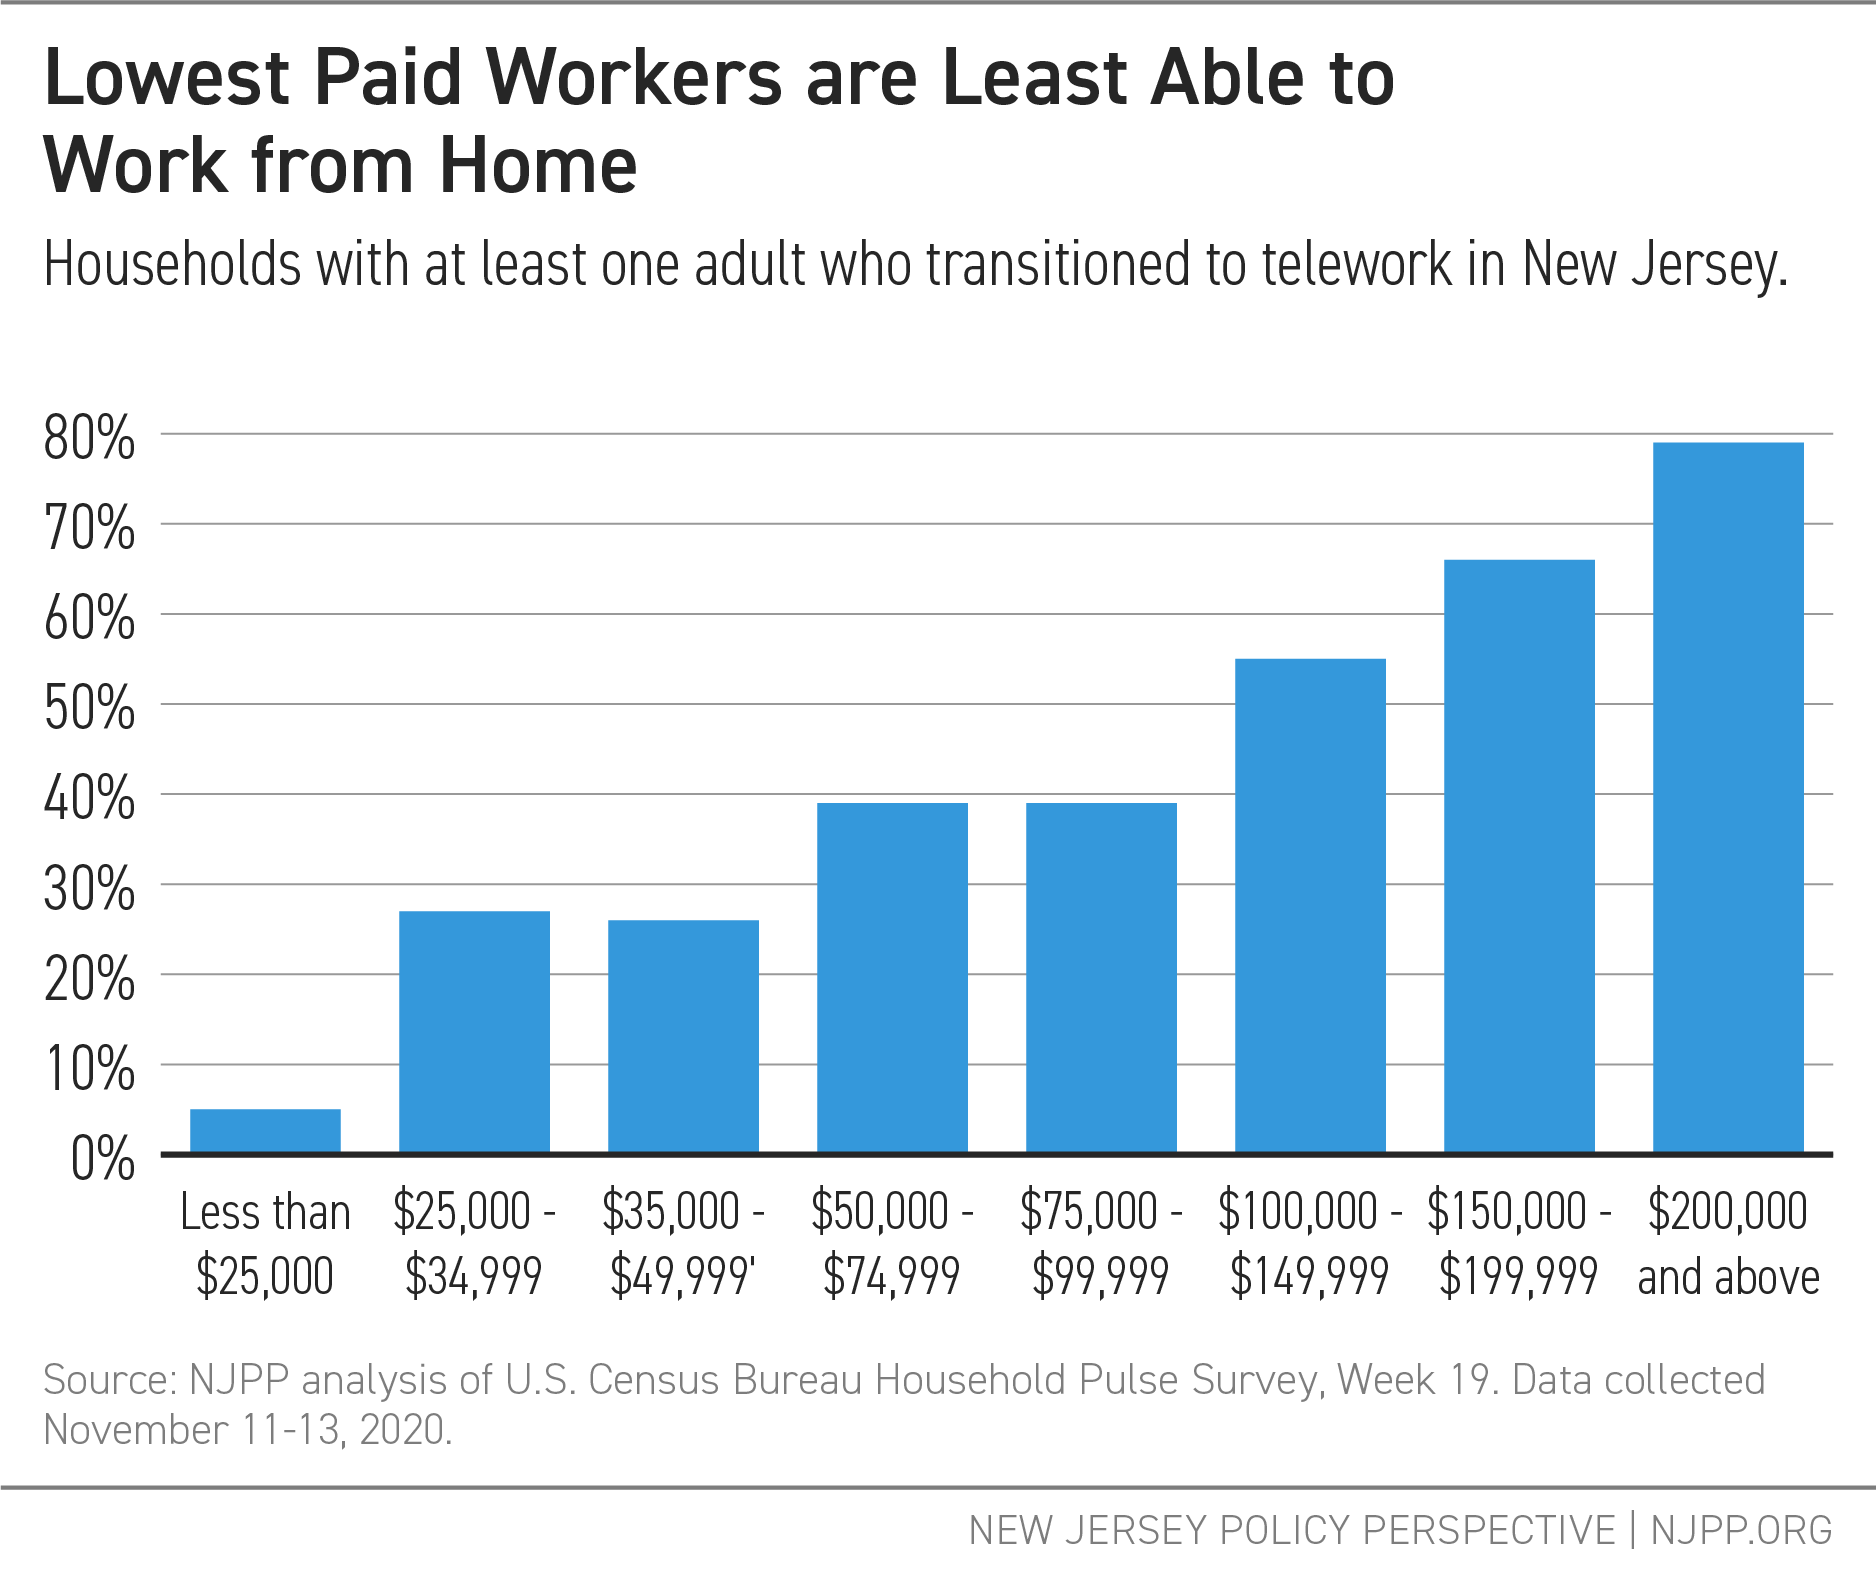
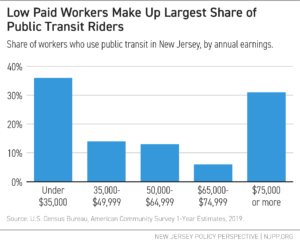
Trends by earnings are similar. Low-income workers are more likely to commute to work by public transit. Over the last 5 years, more than about 36 percent earned $35,000 or less.

Alternatively, over the past 5 years, workers earning $75,000 or more—about 30 percent—use public transit as their primary source of transportation, emphasizing the importance of transit for all income groups.

Mobility through public transit has remained vital during the COVID-19 pandemic. Commuters, many of whom are front-line workers, are using public buses at only a slightly lower frequency as compared to pre-pandemic travel, according to the NJ Transit Customer Travel Survey.[vii] In addition, about 90 percent of these riders have a household income of $75,000 and below, with 10 percent holding more than $75,000 in household income.[viii]

The Environmental and Health Effects of Public Transit

Public transit carries environmental and public health benefits by reducing the number of vehicles on the road, improving air quality, and alleviating traffic congestion and noise.[ix] Transit use supports the growth of more active communities, reduces people’s time spent sedentary in cars, and, as a result, reduces chronic illnesses associated with the sedentary nature of private transit, non-ambulatory commuting.[x] Public health benefits from public transit also result from the increased access to employment, health care services, social services, and food.[xi]

Although public transit positively contributes to environmental and public health outcomes, transit operations also generate negative impacts, which electrification of the bus fleet can offset or eliminate.

Emissions from mobile sources such as cars, trucks, and buses represent the largest share of greenhouse gas emission origination (42 percent) in New Jersey.[xii] Additionally, the vast majority of buses are diesel-powered, and the diesel exhaust emitted by buses and other heavy duty vehicles is a dangerous pollutant that worsens and triggers health problems.[xiii] Older buses deploy fewer diesel emission control technologies, and aging bus fleets have greater diesel emission impacts, particularly on the communities in which they operate.[xiv] The service life of a typical NJ Transit bus is about 12 to 13 years, with some buses approaching 20 years in age.[xv]

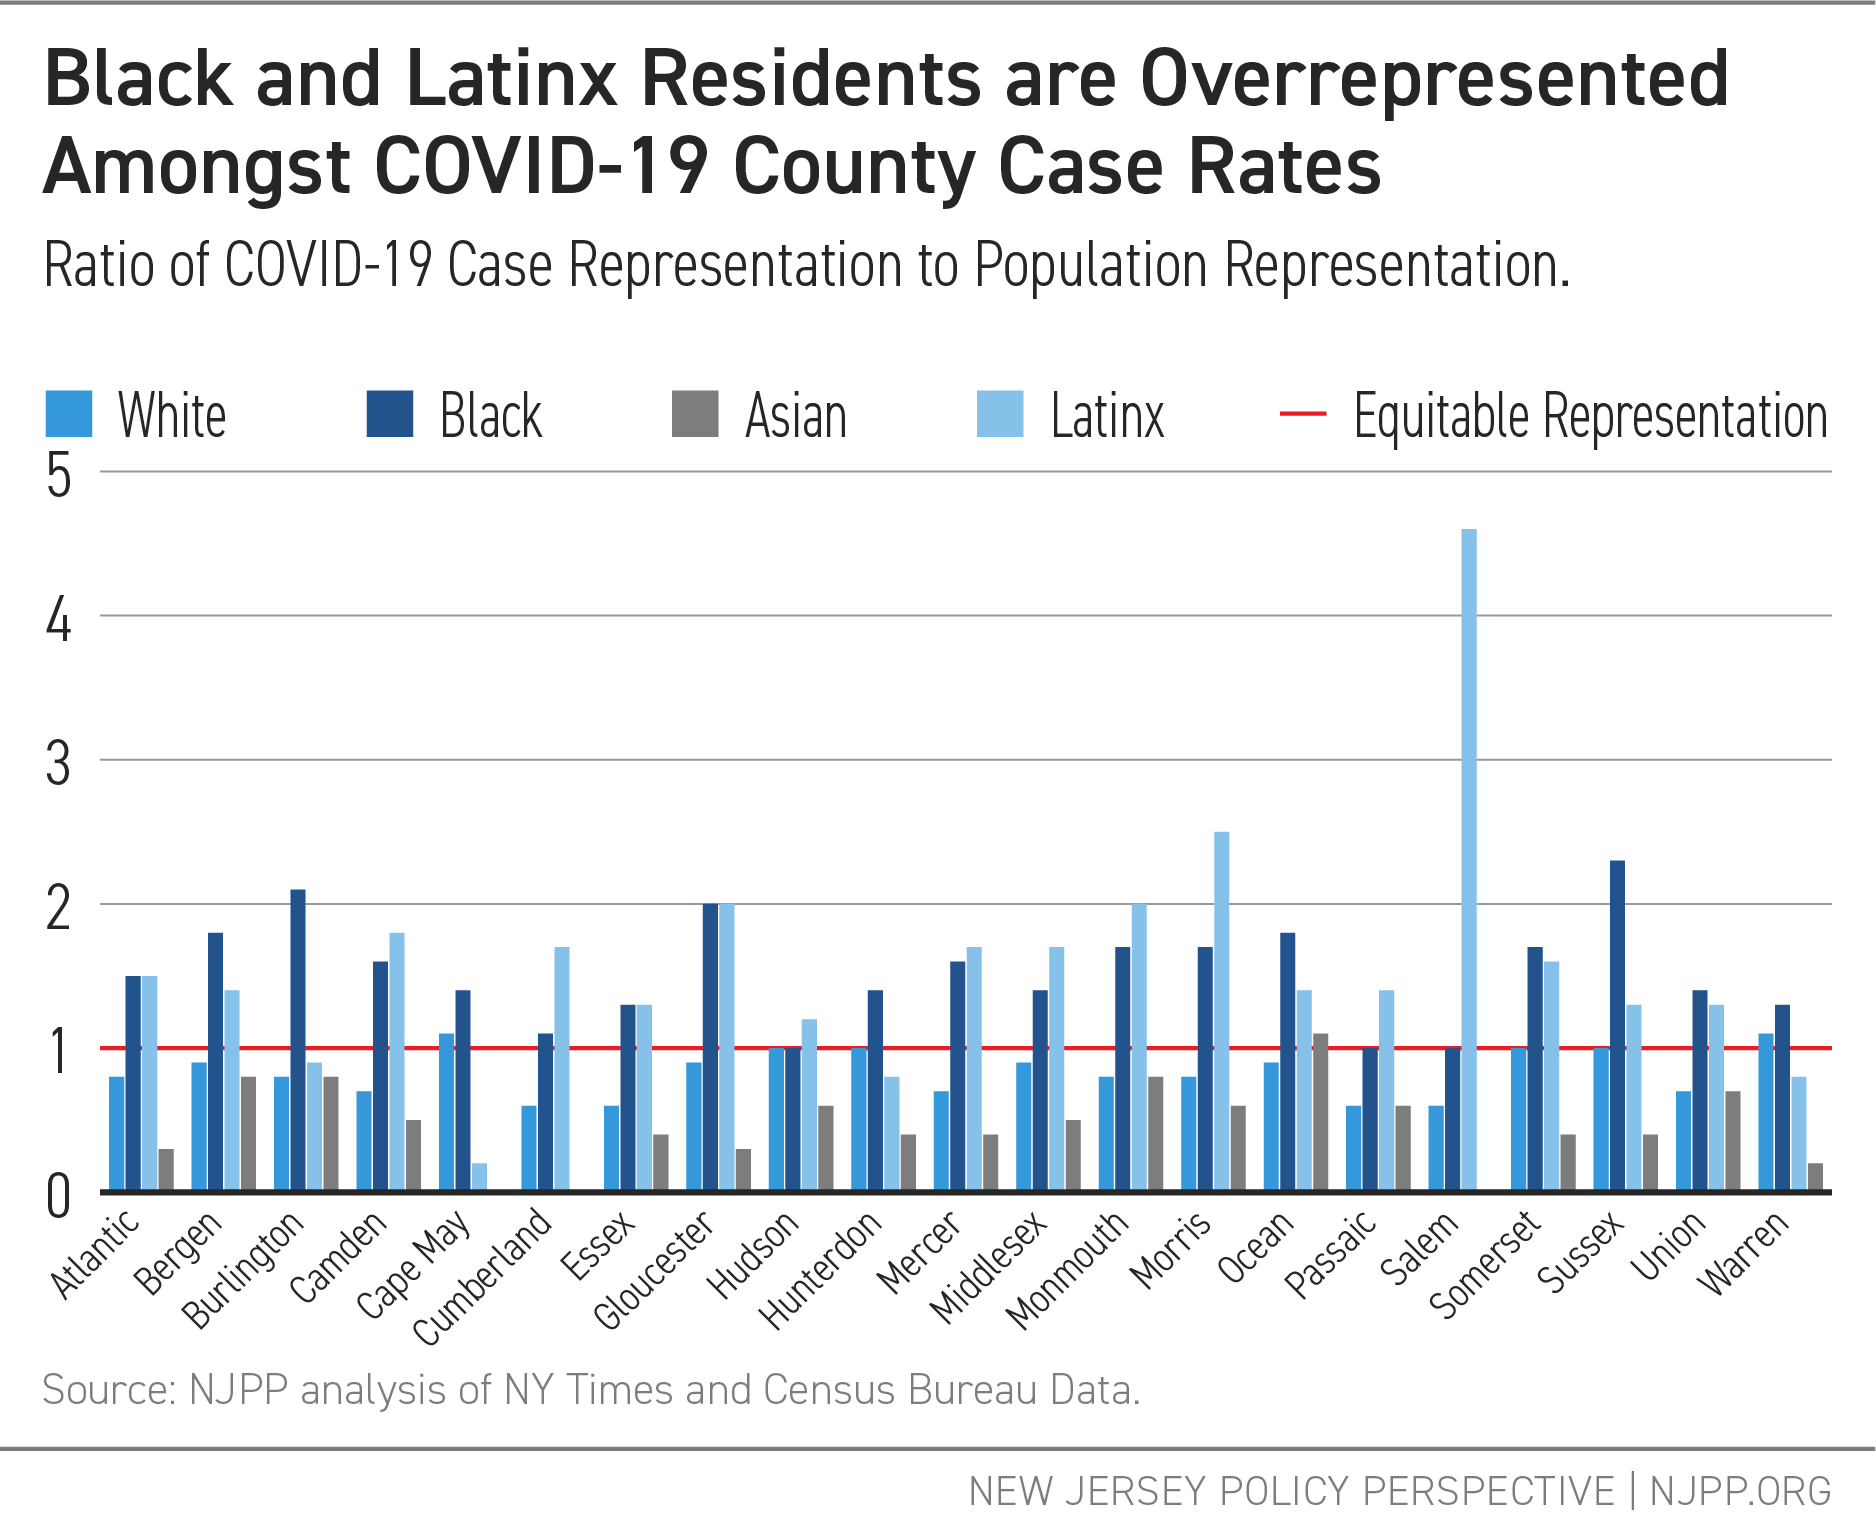
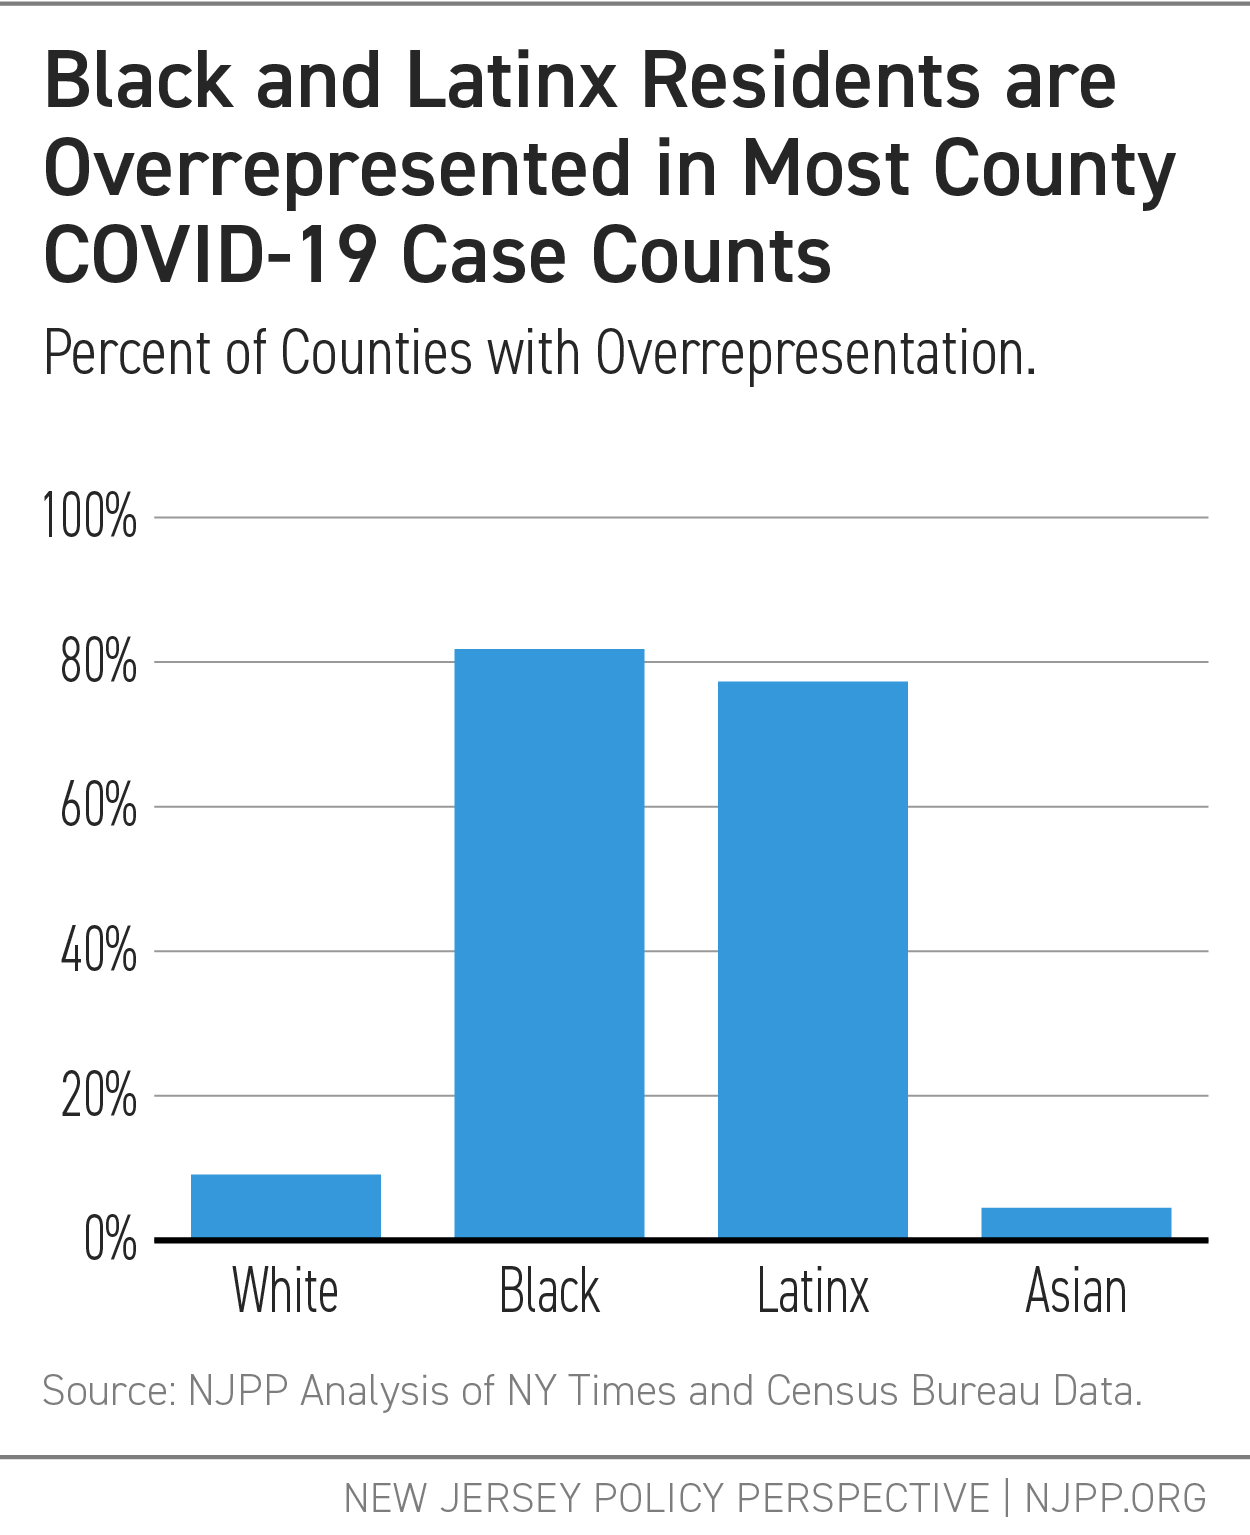
Particulate matter, which are aerosolized solid and liquid pollutants, can harm one’s lungs, heart, and brain.[xvi] New research links this type of pollution to the development of serious diseases, such as dementia.[xvii] What’s worse, studies have also shown that such air pollution can lead to premature death.[xviii] Premature deaths due to fine particulate matter (PM2.5) from roads alone claim up to 2,420 lives every year in New Jersey.[xix] Further, people with COVID-19 who live in areas of high air pollution are more likely to die from the disease, according to Harvard University’s School of Public Health.[xx] And hot spots for the virus are located in predominantly low-income Black neighborhoods.[xxi]

The harmful environmental and public health effects of diesel bus pollution disproportionately harm Black and Brown communities across the nation.[xxii] Bus idling tends to occur more often in these areas, as well.[xxiii] Further, people who live in these communities often live in close proximity to other large and small sources of pollution, as well as old abandoned, contaminated sites, which can pose risks to public health and the environment.[xxiv] This is largely a result of residential segregation, which is caused by structural, institutional, and individual racism. As a result of housing exclusionary housing policies, people of color are often concentrated in neighborhoods that are disempowered and marginalized, both politically and financially.[xxv]

Thankfully, New Jersey is focused on improving air quality by prioritizing the implementation of electric buses. Electric buses can reduce emissions of diesel exhaust, particulate pollution, and other pollutants, improving air quality in communities.[xxvi] For instance, electric buses can reduce greenhouse gas emissions by 75 percent, though this amount is dependent on the source of electricity used to charge buses.[xxvii] Overall, an electric bus eliminates approximately ten tons of nitrogen oxides and 350 pounds of diesel particulate matter over its typical 12-year lifespan.[xxviii] If emissions of diesel pollution in city neighborhoods were curtailed, then urban communities, particularly communities of color and low-income communities, could reap the benefits of public transit without suffering the public health costs.[xxix]

State Policies and Goals around Electrifying Public Buses

In 2020, New Jersey implemented N.J.S.A. 48:25-3 — which will be referred to as the “Electric Vehicle Law” in this report — to set forth targets and various incentives to increase electric vehicle use, spur infrastructure development, and ultimately reduce greenhouse gas emissions from the transportation sector. Part of this legislation directs NJ Transit to purchase battery-operated public buses, with the goal of buying only zero-emission public buses by 2032.[xxx]

NJ Transit Electric Vehicle Purchasing Goals and
Targets Outlined in the Electric Vehicle Law
Goal Target Date
10% December 31, 2024
50% December 31, 2026
100% December 31, 2032

NJ Transit’s current ten-year strategic plan and five-year capital plan dictate how the state phases in the purchases of electric buses, develops related infrastructure, and phases out diesel-fueled buses.[xxxi] The strategic plan presents a roadmap of strategic choices and critical investments, while the capital plan identifies projects, budget considerations, and scheduling.

NJ Transit is currently developing plans for electric bus deployment and to upgrade infrastructure, including the acquisition of specific dispatching technologies to ensure high-quality bus service when the rollout occurs.[xxxii]

Regarding electric bus rollout, NJ Transit’s “Phase 1” plan will replace 68 40-ft diesel transit buses that are currently in service with 68 40-ft electric buses and introduce 11 60-ft electric articulated buses, plus an additional 21 electric articulated buses dedicated for a new bus garage in northern New Jersey.[xxxiii] Later phase details are unknown to the public at the moment, but the estimated total cost to fully electrify the bus fleet is about $5.7 billion by 2040.[xxxiv]

As for bus garages, which will need to be zero-emission ready and capable of storing and maintaining electric buses, NJ Transit plans to construct two additional garages, completely replace four current garages, and modernize the remaining 12 garages, all for an estimated total cost of $2.65 billion.[xxxv] Currently, the transit authority operates 16 bus garages that range between 20 and 120 years old, none of which have been majorly renovated since 1998.[xxxvi]

The two new bus garages, referred to as the “Northern Bus Garage” and “Second Northern Bus Garage,” will likely be located near the Meadowlands. Although NJ Transit has not acquired land for the projects yet, the facilities are expected to include modern features such as solar panels, up-to-date fleet and maintenance equipment, and modifications for electric buses.[xxxvii] Estimated costs for these garages are approximately $928 million, plus the cost of land acquisition.[xxxviii]

NJ Transit also plans to implement a separate Bus Garage Replacement Program, contingent upon receiving necessary funding. The program would replace the four oldest bus garages: the Market Street Garage (Paterson), Oradell Garage (Oradell), Big Tree Garage (Nutley), and Fairview Garage (Fairview). The estimated costs for this program are $609 million.[xxxix] The costs to modernize or replace bus garages include charging infrastructure, unit substations, and maintenance equipment.

Finally, NJ Transit will modernize the remaining 12 bus garages to accommodate electric vehicle charging infrastructure and electric buses. The estimated costs of this modernization process total approximately $1.12 billion.[xl]

NJ Transit Garage Construction and Renovation Plans
Garage Project Location  Time Frame Estimated Costs
Construct 2
New Garages
Northern Bus
Garage, TBA
5 years $536 million
Second Northern Bus
Garage, TBA
9 years $392 million
Replace 4
Old Garages
Paterson, Oradell, Nutley, and Fairview 11 years $608.5 million
Modernize 12
Remaining Garages
Around the State 11 years $1.115 billion
Total $2.65 billion

Source: NJ Transit Capital Plan Financial Summary (Unconstrained) and Economic Impact Study of NJ Transit’s Five Year Capital Plan.

Three major challenges arise with the rehabilitation, modernization, and replacement of existing garages:

  1. The temporary loss of capacity on bus lines, since each garage needs to be taken out of service. This loss of capacity can put a strain on those who rely on bus transportation, particularly low-income individuals.
  2. Some garages may not be able to accommodate the configuration and size of new, larger buses and electric bus fleet upgrades across all neighborhoods due to the narrowness of some streets. However, NJ Transit is conducting analyses at the four locations that will be modernized, identifying routes that can accommodate anticipated electric bus configurations.
  3. The path to determining and securing funding sources for the garage plan rollout, including the purchasing of buses and the development of necessary infrastructure, remains unclear.

NJ Transit’s Timeline to Transition to Electric Buses is Misaligned with Goals Set in the Electric Vehicle Law

The NJ Transit capital plan, published in June 2020, estimates that the total cost to replace the entire diesel fleet will be about $5.7 billion and that a 100-percent fleet transition will not be achieved until 2040, eight years past NJ Transit’s original goal.[xli] The Electric Vehicle Law specifies a target date for 100-percent electric bus purchases by December 2032. Further, while NJ Transit’s five-year $11.21 billion capital plan was approved, with $1.4 billion for projects in the plan for Fiscal Year 2021 alone, there is no clear funding source for the $5.7 billion needed to implement the diesel bus replacement program.[xlii]

 There’s also potential misalignment under NJ Transit’s current strategic plan, too. Through 2026, the transit agency plans to devote about $15 million towards the purchase of electric buses,[xliii] which is a small fraction of the $1.68 billion needed for the implementation of bus purchases and deployment in that time.[xliv] This indicates that less than one percent of bus purchases over the next six years would be electric, which drastically misses the electric bus vehicle goals outlined in the Electric Vehicle Law.[xlv]

However, NJ Transit plans on creating a bus electrification master plan by 2022. As the economic crisis exacerbated by the COVID-19 pandemic continues, the capital and strategic plans may see further changes as well.

Electric Buses: Costs and Savings

To better inform ongoing and future conversations around bus electrification efforts in New Jersey, this section examines the major costs and savings of replacing the entire active fleet with electric buses by the legislative target of 2032.

Bus Purchasing Costs and Savings

NJ Transit has approximately 2,183 active diesel buses in its entire fleet.[xlvi] To accommodate current ridership, the transit authority would need 1.2 electric buses for every diesel bus.[xlvii] As such, about 2,620 electric buses would be needed to replace the current diesel fleet. The approximate cost for a 40 ft-electric bus is about $749,000,[xlviii] whereas a 40-ft diesel bus costs about $500,000.[xlix] Therefore, it would cost about $1.96 billion to replace all diesel buses with electric ones.

Upfront Costs of Electric and Diesel Bus Fleets
Bus Type  Cost per Bus  Total Cost of Fleet
Electric Bus with
450 kWh Batteries
(2,620 buses)
$749,000 $1.96 Billion
Electric Bus
without 450 kWh Batteries
(2,620 buses)
$553,000 $1.45 Billion
Diesel Bus Fleet
(2,183 buses)
$500,000 $1.10 Billion

Source: Proterra; American Public Transit Association.

However, there are opportunities for significant savings. For instance, the costs of electric buses are expected to decline, given the trend of gradually decreasing purchase prices and the increased availability of battery leasing options.[l] For example, the price of electric buses purchased by Foothill Transit, in the San Gabriel Valley of Greater Los Angeles, declined from $1 million in 2009 for a 35-ft electric bus to $789,000 in 2015 for a 40-ft bus.[li] Some transit agencies have even purchased electric buses for less than $700,000 when bought in bulk. For example, LA Metro purchased 60 electric buses at the price of $686,000 in 2017 from Build Your Dreams (BYD), another electric bus manufacturer.[lii] What’s more, new manufacturers are designing lighter buses at potentially lower costs. For instance, Arrival, a U.K.-based electric vehicle startup with a factory in New Jersey, claims that their electric buses will be priced much like diesel buses, significantly lowering the total cost of ownership.[liii]

The cost of batteries, which are approximately a quarter of the total cost of an electric bus, are declining by 5 to 10 percent each year.[liv] And since 2010, battery prices have fallen by 79 percent.[lv] In 2017, lithium-ion battery prices were $209/kWh, down significantly from $1,000/kWh in 2010.[lvi]

As the cost for electric batteries continues to decline, battery-leasing options are also becoming more available.[lvii] This method allows NJ Transit to pay for batteries slowly over the lifespan of the electric bus. For example, a Proterra electric bus with batteries costs approximately $749,000, whereas one without batteries costs about $553,000.[lviii]

Maintenance Costs and Savings

Currently, NJ Transit spends approximately $263 million per year on maintenance for diesel buses.[lix] However, there can be significant savings with electric buses, which result from no longer needing to address mechanical service required by an internal combustion engine (ICE), lack of oil and filter changes, and fewer tires and brake pad replacements.[lx] Transitioning to electric buses can potentially save about $81,500 per bus, per year, or $213.7 million for the electric bus fleet, per year.

Maintenance Costs and Savings, Electric and Diesel Buses
  Diesel  Electric
Cost per Mile $2.93 $0.55
Cost per Year $263.1 Million $49.4 Million
Savings per Bus N/A $81,500
Savings per Bus/Year N/A $213.7 Million

Source: NJ Transit; U.S. PIRG.

Fuel Costs and Savings 

With the conversion to electric buses, NJ Transit can expect major savings on fuel costs, as electric buses will not need diesel fuel, which costs New Jersey about $2.81 per gallon, or about $61.6 million per year to fuel its diesel fleet. The electric cost per bus is about $0.19 per mile, which would cost about $17.1 million per year. Overall, the state could potentially save approximately $44.5 million per year in fuel costs.

Fuel Costs and Savings, Electric and Diesel Buses
  Diesel  Electric
Cost per Mile $2.81 $0.19
Cost per Year $61.6 Million $17.1 Million
Savings per Bus/Year N/A $44.5 Million

Source: NJ Transit; U.S. PIRG.

Other Costs

Charging Infrastructure

In addition to the costs mentioned above, electric buses come with charging infrastructure costs. However, costs for each charger installation are site-specific and costs can vary significantly depending on site characteristics.[lxi] While NJ Transit will most likely pursue a mix of fast chargers, slow chargers, and overhead charging stations — in the same way other transit agencies across the nation that are implementing the rollout of electric buses have[lxii] — the transit authority will need to conduct a technical route analysis to determine its charging infrastructure needs. This kind of assessment considers rider demand, location, and duration of the pre-existing bus routes. For example, King County Metro Transit’s charging infrastructure cost for a fast charger serving four electric buses is an estimated $144,000, and for a slow-charger serving two electric buses, $34,000.[lxiii] In addition to chargers, the installation for supporting infrastructure will also need to take place. Transit agencies report that supporting infrastructure, like an overhead direct current (DC) charging pantograph, may cost between $80,000 to $110,000 per unit.[lxiv]

Training

A transition to electric buses will require training for operators and maintenance workers. While a bus manufacturer like Proterra provides free initial training for operators and maintenance workers,[lxv] the state will need to offer more robust opportunities for workers to train and learn. Currently, NJ Transit’s annual maintenance and operator training for diesel buses costs $1,500,000 and $3,900,000, respectively.[lxvi] As the state procures more electric buses, training will continue for bus operators and maintenance workers on remaining diesel buses, while simultaneously building the capacity for bus operators and maintenance workers who will transition to electric bus operations.

Other Savings

Health Savings

Harmful emissions increase the incidence of illnesses and respiratory diseases, which impose healthcare costs. Conversion to electric buses is estimated to reduce hospitalization and emergency room costs, as well as the costs of missing work.[lxvii] For instance, residents in Chicago and New York City can expect an average of $55,000 and $150,000 in health savings per electric bus per year, respectively, once their city’s fleets are fully electrified.[lxviii] Further, using the same methodology, D.C. residents should expect about $8 million per year in healthcare savings from electrifying the Metropolitan Area Transit bus fleet.[lxix]

Greenhouse Gas Savings

Conversion to electric buses brings greenhouse gas savings, which are generally monetized using the social cost of carbon. Specifically, this cost measures the economic harm from climate change — such as extreme weather events, the spread of disease, food insecurity — on businesses, families, and governments. These impacts are expressed as the dollar value of the total damages from emitting one ton of carbon dioxide into the atmosphere.[lxx] The savings accrued through carbon reduction from electric buses is about $3,000 per bus per year.[lxxi] For New Jersey, this means the state can expect around $8 million greenhouse gas savings in a single year from the electric bus fleet and about $95.9 million over the 12-year lifespan of electric buses.[lxxii]

Recommendations to Help Offset Costs to New Jersey’s Electrification Efforts

 This section explores potential funding opportunities from state, regional, and federal sources to support NJ Transit’s bus electrification efforts.

State-Level

Highway Widening Funds

In June 2020, Governor Murphy approved plans to expand the NJ Turnpike, the Garden State Parkway, and the Atlantic City Expressway in the Pinelands, costing an estimated $16 billion.[lxxiii] However, advocates are calling to dedicate these funds to mass transit and bus electrification as expanding highways encourages more automobile travel and worsens congestion — increasing emissions in overburdened communities.[lxxiv] By putting more funding into mass transit, New Jersey can better support commuters, specifically essential and front-line workers who rely on NJ Transit’s daily bus services, and reduce air pollution from transportation.

 Clean Energy Program Funds

The state frequently diverts Clean Energy Program funds to support NJ Transit operations.[lxxv] However, transit operations are not in line with the fund’s purpose, which is to offer financial incentives, programs, and services to help save energy, money, and the environment for residents, businesses, and local governments.[lxxvi] If the state insists on continuing to use these funds, they would be better allocated to bus electrification, which is more in line with the fund’s mission.

To limit these diversions and leave more funds available in NJ Transit’s capital budget for electrification projects, the state should use the annual $375 million (gradually increasing to $525 million per year) that the Commissioner of the state Department of Transportation pledged to give to NJ Transit’s operating budget from the NJ Turnpike Authority.[lxxvii] Currently, the transfer is set at $129 million because the balance was put into escrow; however, this should be available sometime in Fiscal Year 2022.[lxxviii]

Progressive Taxation

In the wake of the COVID-19 pandemic and the current recession, more revenue will be required to support important investments. While not all new revenue sources would be dedicated to public transit, growing the proverbial pie would help free up other resources for important issues that certainly include transit. Thankfully, the millionaires’ tax, which raises the top income tax rate to 10.75 percent for incomes over $1 million, was passed in September 2020.[lxxix] This tax is expected to bring about $400 million for Fiscal Year 2021 reaching up to $450 million each year thereafter.[lxxx] However, more options must be considered.

New Jersey has the opportunity to restore its sales tax to seven percent and modernize it to include more services, especially those used by higher-income households, like chartered flights, interior decorating, and limousine services. Additionally, the state can restore the estate tax with a higher threshold that would help it regain the lion’s share of the revenue it previously collected while ensuring that the wealthiest heirs pay their fair share at the state level. Reinstating the tax on estates worth more than $1 million would recoup 93 percent of the tax revenue that the state formerly collected from this source.[lxxxi] The overall revenue collected can enhance public services for New Jersey residents, and the funding of electric buses, electric bus garages, and the requisite charging infrastructure should be a top priority.

Regional-Level

Transportation and Climate Initiative Program (TCI-P)

TCI is a regional collaboration of Northeast and Mid-Atlantic States and the District of Columbia that seeks to improve transportation, develop the clean energy economy, and reduce carbon pollution from the transportation sector.[lxxxii] The states have proposed a “cap and invest” model, TCI-P, where an increasingly strict limit would be placed on carbon dioxide pollution (CO2) produced by fuel companies. Companies would purchase “pollution permits” through regular auctions to cover the amount of pollution they plan to emit. The proceeds generated would be divided amongst participating states and invested in programs such as increased public transit, active transportation like walking and biking, and electrifying vehicles. Supply and demand determine the price of these permits, and the program would allow a company to buy more permits if they need a higher clearance to pollute or sell extra pollution permits for a profit.

Preliminary revenue estimates from the TCI-P for New Jersey, based on the memorandum of understanding (MOU) released in December 2020 between four participating jurisdictions,[lxxxiii] indicate $236 million in 2023, growing to $339 million in 2032, and with a cumulative amount of $2.875 billion over 10 years. Realizing this revenue will require legislative action, which has not yet begun. However, New Jersey remains at the table for the development of this program.

While this can be a significant funding source, there are concerns from overburdened communities — who often bear the brunt of air pollution from transportation — and other advocates as to how much pollution TCI-P will reduce and how the funds will be spent. Market-based programs, like TCI-P, can only limit the total emissions, not guarantee pollution reduction in any specific community, like those most harmed.[lxxxiv] However, through the MOU and the recently released draft model rules,[lxxxv] states are committing to invest no less than 35 percent of proceeds to ensure that overburdened and underserved communities benefit equitably from clean transportation projects and programs. In addition, the TCI-P states commit to establish an Equity Advisory Body — composed of diverse stakeholder groups, with a majority of members representing overburdened and underserved communities — or designate an existing body that meets this description, to advise on decision-making and equitable outcomes for TCI-P. While this stated intention is important, ultimately, an MOU or draft model rules cannot require participating states to prioritize funding or pollution reductions in overburdened communities. Therefore, legislation would need to be explicit about reducing the harms in the communities most harmed by air pollution.

Federal-Level

Federal Grants

The Volkswagen Environmental Mitigation Trust allocates funding to states to use for defined eligible projects that reduce Oxides of Nitrogen (NOx) as well as support the expansion of zero-emission vehicle adoption.[lxxxvi] Specifically, this funding can be used to purchase electric buses and invest in charging infrastructure. NJ Transit has already been awarded $8 million to purchase eight electric buses in Camden;[lxxxvii] in total, New Jersey’s allocation under the federal settlement was $72.2 million.[lxxxviii]

In addition, the U.S. Department of Transportation offers grants to states to support public transit. For instance, NJ Transit was granted about $7 million in funding in Fiscal Year 2020 to purchase new electric buses for service expansion purposes through the Federal Transit Administration’s (FTA) Low or No-Emission (Low-No) Grant Program.[lxxxix]

Other grant opportunities from the U.S. Department of Transportation include the FTA’s Bus and Bus Facilities Grant Program, which will provide a combined $464 million to grantees.[xc] Under this grant for FY 2020, New Jersey received $14.7 million to modernize the Wayne Bus Garage.[xci] There’s also the Better Utilizing Investments to Leverage Development (BUILD) Transportation Discretionary Grant Program, which provided a combined $1 billion to grantees in 2020.[xcii]

Other Recommendations for a More Equitable Transition

This section offers recommendations for a smoother and more equitable transition to electric bus infrastructure.

Energy and Electricity Resiliency

Energy resiliency is having a reliable, regular supply of energy and measures in place to minimize disruptions to energy service, such as power failures or state of emergencies.[xciii] Specifically, NJ Transit can strengthen resilience through the following:

  • Energy Reliability: Many factors can affect bus mileage, such as temperature and the number of stops, which can affect the reliability of electric buses during an emergency. During the procurement process, NJ Transit can test vehicles’ battery capacity in an operational setting to understand resiliency needs in advance, similar to how the Chicago Transit Authority operates.[xciv]
  • Electric School Buses: Electric school buses with Vehicle-to-Grid capability have the capacity to both recharge their battery and feed energy back to the grid. At the University of California San Diego, electric vehicles are becoming a part of the campus’s electric grid during the day, in order to support peak energy usage.[xcv] NJ Transit can work with school authorities to maximize electric resiliency when electric school buses begin to see implementation in New Jersey.


NJ Transit has been able to mobilize its diesel bus fleet during challenging events in the past, such as the attacks on September 11th in 2001 and the difficulties during Hurricane Sandy in 2012. Still, it will be more challenging to maintain energy storage for electric buses in statewide emergencies. With just 42.6 megawatts of capacity installed in 2019,[xcvi] New Jersey has a long way to go to achieve its goals of 600 megawatts of energy storage by 2021, and 2,000 megawatts by 2030, as required by the Clean Energy Act.[xcvii]

Coordination with Other Agencies

NJ Transit should coordinate with the following as it transitions to an all-electric bus fleet:

  • NJ Board of Public Utilities (BPU): BPU and NJ Transit can work together to roll out electric buses, particularly around bus depot upgrades and charging infrastructure.
  • New York Metropolitan Transportation Authority (MTA): NJ Transit could potentially coordinate with MTA to share costs of charging infrastructure. NJ Transit operates in Manhattan through New York’s Port Authority Midtown Bus Terminal and the authorities can ensure that they can charge buses on each other’s grids.
  • Port Authority of New York and New Jersey (PANYNJ): NJ Transit and PANYNJ should share information concerning use of technology and other lessons learned as PANYNJ rolls out electric buses. They could also potentially share the costs of the charging infrastructure by using each other’s grids, particularly since PANYNJ has plans to redesign their bus terminal in Manhattan, the busiest bus terminal in the country, with charging equipment for electric buses.[xcviii]
  • New Jersey Department of Environmental Protection (DEP): DEP, in coordination with NJ Transit, should measure and oversee the effects of electric buses on air quality, especially in overburdened communities. While DEP already operates 30 air monitoring stations across the state, New Jersey can better maximize its monitoring network, much like Utah does. The Utah Department of Environmental Quality’s Division of Air Quality uses a variety of tools to address air pollution, such as permit conditions, air-quality research and planning, and enforcement actions.[xcix] By tying monitoring alerts to the pollution in neighborhoods, a concentrated effort can be made to reduce pollution across the state, while also identifying areas where electrification efforts are needed the most.


Coordination with Communities 

NJ Transit should make the electric bus implementation process transparent and inclusive by holding regular meetings with trusted community leaders and community-based organizations, like Ironbound Community Corporation and Make the Road New Jersey. This will ensure that the implementation’s progress is shared directly with the most impacted people and communities on a regular basis.

Further, NJ Transit should prioritize outreach campaigns in various languages to bring awareness and information about bus electrification efforts. Many people in New Jersey rely on bus transportation for their livelihoods. Therefore, the agency should communicate safety, affordability, benefits to health and the environment, and how those benefits pertain to each community.

Coordination with Transit Workers

The state should support workforce retraining, as electrification requires training in new technology, placement in quality jobs for existing transit workers, and apprenticeships for incoming transit workers. Re-employment and training programs can also be used to structure certifications and ensure that new electric vehicle-related opportunities do not undermine the existing skills that workers have or erode quality standards for the existing workforce.

In addition, safety training and precautions must be prioritized for transit workers. NJ Transit, along with the New Jersey Amalgamated Transit Union (ATU), should ensure that bus manufacturers redesign airflow on buses, especially during health pandemics. In 2020 alone, 15 NJ Transit workers died from COVID-19.[c] Further, there should be more investment in safety training to include an overview of hazards associated with battery chargers, harms associated with hydrogen fuel cells as compared to conventional fuels, battery-specific safety hazards, such as electrocution, arcing, and fires from short circuits, and more.[ci]

Acknowledgments from the Author

To the endowment bestowed through the Kathleen Crotty Fellowship and The Energy Foundation, thank you for funding my research and empowering me to learn about such a critical development in the state’s transportation sector.

A sincere thank you to every single person I spoke with while writing this report, beginning with Dan Fatton, Doug O’Malley, and Nat Bottigheimer. I truly appreciate our meaningful conversations and your patience with me.

Thank you to representatives from NJ Transit, ChargeEVC, Proterra, Tri-State Transportation, New Jersey Board of Public Utilities, Amalgamated Transit Union, Rutgers University, Port Authority of New York and New Jersey, Clean Water Action, Jobs to Move America, New Jersey Department of Environmental Protection, Make the Road – New Jersey, Ironbound Community Corporation, and urban planners from across the nation. Your advice, insight, and expertise were invaluable.

Thank you to everyone at New Jersey Policy Perspective — Sheila, Louis, David, Brittany, and Vineeta — for being the most supportive colleagues. A special shout out to Brandon McKoy, who always took the time to provide me with his guidance. He truly leads with a vision like no other, grounded in equitable solutions and amplifying the voices of all New Jerseyans.

And finally, thank you Nicole Rodriguez. You are the best mentor and boss I could ever ask for. I am forever indebted to you. Thank you for being patient. I have learned so much from you, and I know you will be a lifelong mentor.


Endnotes

[i] U.S. PIRG Education Fund, Environment America Research and Policy Center, and Frontier Group. (2019). Electric Buses in America: Lessons from Cities Pioneering Clean Transportation. Page 10. https://uspirg.org/sites/pirg/files/reports/ElectricBusesInAmerica/US_Electric_bus_scrn.pdf; Ernani F. Choma, John S. Evans, James K. Hammitt, José A. Gómez-Ibáñez, John D. Spengler. (2020). Assessing the health impacts of electric vehicles through air pollution in the United States, Environment International, Volume 144, 2020, 106015, https://doi.org/10.1016/j.envint.2020.106015.

[ii] U.S. PIRG Education Fund, Environment America Research and Policy Center, and Frontier Group. (2019). Electric Buses in America: Lessons from Cities Pioneering Clean Transportation. Page 4. https://uspirg.org/sites/pirg/files/reports/ElectricBusesInAmerica/US_Electric_bus_scrn.pdf

[iii] U.S. Census Bureau, American Community Survey. (2019). 1-Year Estimates, share of workers who use public transportation by yearly earnings, 16 years and over, New Jersey
https://data.census.gov/cedsci/table?q=earning&text=transportation&t=Income%20and%20Poverty&g=0400000US34&tid=ACSDT1Y2019.B08119&hidePreview=true

[iv] 267.3 million refers to unlinked bus trips. New Jersey Transit. (FY 2019). Facts at a Glance. https://d2g63oyneaimm8.cloudfront.net/sites/default/files/pdfs/FactsAtaGlance.pdf

[v] National Equity Atlas. (2018). Car access: Everyone needs reliable transportation access and in most American communities that means a car. New Jersey data. PolicyLink. https://nationalequityatlas.org/indicators/Car_access#/?geo=02000000000034000

[vi] National Equity Atlas. (2018). Car access: Everyone needs reliable transportation access and in most American communities that means a car. New Jersey data. PolicyLink. https://nationalequityatlas.org/indicators/Car_access#/?geo=02000000000034000

[vii] Frontline workers are workers within essential industries who must physically show up to their jobs, such as in hospitals, food service, and in transportation.

NJ Transit. (2020, June). Board Operations and Customer Service, Public Committee Meeting, June 26, 2020. Customer Travel Survey. Page 33.

[viii] NJ Transit. (2020, June). Board Operations and Customer Service, Public Committee Meeting, June 26, 2020. Customer Travel Survey. Page 37. 90 percent does not include bus trips to New York but in North Jersey (90 percent) and South Jersey (94 percent).

[ix] Zhang, K., & Batterman, S. (2013). Air pollution and health risks due to vehicle traffic. The Science of the total environment, 450-451, 307–316. https://doi.org/10.1016/j.scitotenv.2013.01.074

[x] Center for Advanced Infrastructure and Transportation (CAIT) Rutgers University. (2020). Economic Impact Study of NJ Transit’s Five-Year Capital Plan. Population Health, Page 17. https://njtplans.com/downloads/capital-plan/Final%20Report_Economic%20Impact%20Study%20of%20NJ%20TRANSIT’s%205-year%20Capital%20Plan%206-5-20.pdf

[xi] Center for Advanced Infrastructure and Transportation (CAIT) Rutgers University. (2020). Economic Impact Study of NJ Transit’s Five-Year Capital Plan. Population Health, Page 17. https://njtplans.com/downloads/capital-plan/Final%20Report_Economic%20Impact%20Study%20of%20NJ%20TRANSIT’s%205-year%20Capital%20Plan%206-5-20.pdf

[xii] NJ Department of Environmental Protection. (2019). 2018 Statewide Greenhouse Gas Emissions Inventory. Page 4. https://www.nj.gov/dep/aqes/pdf/GHG%20Inventory%20Update%20Report%202018_Final.pdf

[xiii] U.S. Department of Transportation. Zero Emission Buses. Sierra Club https://www.transportation.gov/sites/dot.gov/files/images/Zero%20Emission%20Buses.pdf;  U.S. Department of Transportation. (2015). Cleaner Air. https://www.transportation.gov/mission/health/cleaner-air

[xiv] Cooper, Erin, Arioli, Magdala, Carrigan, Aileen, & Jain, Umang. (2012, October). Exhaust Emissions of Transit Buses: Sustainable Urban Transportation Fuels and Vehicles. World Resources Institute. Page 2. https://wrirosscities.org/sites/default/files/Exhaust-Emissions-Transit-Buses-EMBARQ.pdf

[xv] NJ Transit. (2020a, June). Capital Plan Project Sheets, Appendix B: Bus Fleet. https://njtplans.com/downloads/capital-project-sheets/separated/NJ_Transit_Bus_Fleet.pdf

[xvi] American Lung Association. (2020, April 20). Particle Pollution. https://www.lung.org/clean-air/outdoors/what-makes-air-unhealthy/particle-pollution

[xvii] American Lung Association. (2020, April 21). Nearly Half of U.S. Breathing Unhealthy Air; Record-breaking Air Pollution in Nine Western Cities. Press Release. https://www.lung.org/media/press-releases/state-of-the-air-2020

[xviii] National Institutes of Health (NIH), (2018, January 23). Air pollution linked to risk of premature death. https://www.nih.gov/news-events/nih-research-matters/air-pollution-linked-risk-premature-death

[xix] PM2.5 refers to particulate matter less than 2.5μm in diameter.
Fabio Caiazzo, Akshay Ashok, Ian A. Waitz, Steve H.L. Yim, Steven R.H. Barrett. (2013). Air pollution and early deaths in the United States. Part I: Quantifying the impact of major sectors in 2005, Atmospheric Environment, Volume 79, 2013, Pages 198-208, ISSN 1352-2310. Table 5. https://www.sciencedirect.com/science/article/pii/S1352231013004548

[xx] Air pollution linked with higher COVID-19 death rates. (2020, May 5). News. https://www.hsph.harvard.edu/news/hsph-in-the-news/air-pollution-linked-with-higher-covid-19-death-rates/

[xxi] What Do Coronavirus Racial Disparities Look Like State By State? (2020, May 30). National Public Radio. https://www.npr.org/sections/health-shots/2020/05/30/865413079/what-do-coronavirus-racial-disparities-look-like-state-by-state

[xxii] Disparities in the Impact of Air Pollution. (2020, April 20). American Lung Association. https://www.lung.org/clean-air/outdoors/who-is-at-risk/disparities

[xxiii] Union of Concerned Scientists. (2019). Inequitable Exposure to Air Pollution from Vehicles in the Northeast and Mid-Atlantic. https://www.ucsusa.org/resources/inequitable-exposure-air-pollution-vehicles

[xxiv] Commonwealth of Massachusetts. (2017). Environmental Justice Policy of the Executive and Office of Energy and Environmental Affairs. Page 1. https://www.mass.gov/doc/open-space-and-recreation-plan-workbook/download

[xxv] The Century Foundation. (2020). Environmental Racism Has Left Black Communities Especially Vulnerable to COVID-19. https://tcf.org/content/commentary/environmental-racism-left-black-communities-especially-vulnerable-covid-19/?agreed=1

[xxvi] U.S. PIRG Education Fund, Environment America Research and Policy Center, and Frontier Group. (2019). Electric Buses in America: Lessons from Cities Pioneering Clean Transportation. Page 9. https://uspirg.org/sites/pirg/files/reports/ElectricBusesInAmerica/US_Electric_bus_scrn.pdf

[xxvii] Antti Lajunen, Timothy Lipman. (2016). Lifecycle cost assessment and carbon dioxide emissions of diesel, natural gas, hybrid electric, fuel cell hybrid and electric transit buses. Volume 106, 2016, Pages 329-342, ISSN 0360-5442, https://doi.org/10.1016/j.energy.2016.03.075.

[xxviii] Strauss, Rebecca. (2019). “Electric Buses and Clean Energy Financing: How Transit Authorities Can Leverage State and Federal Funds to Buy More Zero-Emission Buses” Georgetown Environmental Law Review. Volume 32. Issue 1. Fall 2019. Page 148. https://www.law.georgetown.edu/environmental-law-review/wp-content/uploads/sites/18/2020/01/GT-GELR190049.pdf

[xxix] U.S. PIRG Education Fund, Environment America Research and Policy Center, and Frontier Group. (2019). Electric Buses in America: Lessons from Cities Pioneering Clean Transportation. Page 10. https://uspirg.org/sites/pirg/files/reports/ElectricBusesInAmerica/US_Electric_bus_scrn.pdf

[xxx] N.J.S.A. 48:25-3. https://lis.njleg.state.nj.us/nxt/gateway.dll?f=templates&fn=default.htm&vid=Publish:10.1048/Enu

[xxxi] NJ Transit. (2020). NJ Plans. https://njtplans.com/

[xxxii] New Jersey Transit, personal communication, August 2020.

[xxxiii]  NJ Transit. (2020a, June). Capital Plan Project Sheets, Appendix B: Bus Fleet. Page 2. https://njtplans.com/downloads/capital-project-sheets/separated/NJ_Transit_Bus_Fleet.pdf

[xxxiv] NJ Transit. (2020a, June). Capital Plan Project Sheets, Appendix B: Bus Fleet. Page 5. https://njtplans.com/downloads/capital-project-sheets/separated/NJ_Transit_Bus_Fleet.pdf

[xxxv] NJ Transit. (2020, June). Unrestrained Financial Summary. Appendix A. Table 2. Page 5. https://njtplans.com/downloads/capital-plan/NJ_Transit_Capital_Plan_Financial_Summary_(Unconstrained).pdf

[xxxvi] NJ Transit. (2020, June). Capital Plan Project Sheets, Appendix B: Bus Garages. Page 2. https://njtplans.com/downloads/capital-project-sheets/separated/NJ_Transit_Bus_Garages.pdf

[xxxvii] NJ Transit. (2020c, June). Capital Plan Financial Summary (Unconstrained). Page 2. https://njtplans.com/downloads/capital-plan/NJ_Transit_Capital_Plan_Financial_Summary_(Unconstrained).pdf

[xxxviii] NJ Transit. (2020, June). Capital Plan Financial Summary (Unconstrained). Appendix A https://njtplans.com/downloads/capital-plan/NJ_Transit_Capital_Plan_Financial_Summary_(Unconstrained).pdf

[xxxix]  NJ Transit. (2020, June). Capital Plan Project Sheets, Appendix B: Bus Garages. https://njtplans.com/downloads/capital-project-sheets/separated/NJ_Transit_Bus_Garages.pdf

[xl] NJ Transit. (2020, June). Capital Plan Project Sheets, Appendix B: Bus Garages. https://njtplans.com/downloads/capital-project-sheets/separated/NJ_Transit_Bus_Garages.pdf;  NJ Transit. (2020c, June). NJT Capital Plan Unconstrained Financial Summary. https://njtplans.com/downloads/capital-plan/NJ_Transit_Capital_Plan_Financial_Summary_(Unconstrained).pdf

[xli] NJ Transit. (2020a, June). Capital Plan Project Sheets, Appendix B: Bus Fleet.  https://njtplans.com/downloads/capital-project-sheets/separated/NJ_Transit_Bus_Fleet.pdf

[xlii] Politico Pro New Jersey. (2020, October 22). “NJ Transit board approves $2.6B budget with no fare increase.” https://subscriber.politicopro.com/states/new-jersey/story/2020/10/22/nj-transit-board-approves-26b-budget-with-no-fare-increase-1329547

[xliii] Johnson, T. (2020, June 19). NJ Transit Misses the Mark by Committing Just $15M to Electric Buses Through 2026, Critics Say. NJ Spotlight News. https://www.njspotlight.com/2020/06/nj-transit-misses-the-mark-by-committing-just-15m-to-electric-buses-through-2026-critics-say/

[xliv] NJ Transit. (2020c, June). NJT Capital Plan Unconstrained Financial Summary. Page 6. Table 2. https://njtplans.com/downloads/capital-plan/NJ_Transit_Capital_Plan_Financial_Summary_(Unconstrained).pdf

[xlv] NJ Transit. (2020c, June). NJT Capital Plan Unconstrained Financial Summary. https://njtplans.com/downloads/capital-plan/NJ_Transit_Capital_Plan_Financial_Summary_(Unconstrained).pdf

[xlvi] Government and External Affairs Department, New Jersey Transit, personal communication, August 2020.

[xlvii] NJ Transit and Rocky Mountain Institute. (January, 2020.) Bus Electrification Workshop. Slide 30.

[xlviii]Proterra. (2017). Current State of Public Transit Funding Options for Electric Vehicles and Charging Systems. American Public Transportation Association. https://www.apta.com/wp-content/uploads/Resources/mc/sustainability/previous/2017sustainability/presentations/Presentations/Current%20State%20of%20Public%20Transit%20Funding%20Options%20for%20Electric%20Vehicles%20and%20Charging%20Systems%20-%20Alan%20Westenskow.pdf

[xlix]Dickens, M. (2020, July 31). Public Transportation Vehicle Database [Dataset]. American Public Transportation Association. https://www.apta.com/research-technical-resources/transit-statistics/vehicle-database/

[l] Quarles, Neil, Kara Kockelman, and Moataz Mohamed. (2020) “Costs and Benefits of Electrifying and Automating Bus Transit Fleets,” Sustainability.https://doi.org/10.3390/su12103977; Lajunen, A., & Lipman, T. (2016). Lifecycle cost assessment and carbon dioxide emissions of diesel, natural gas, hybrid electric, fuel cell hybrid and electric transit buses. Energy, 106, 329–342.http://doi.org/10.1016/j.energy.2016.03.075

[li] L. Eudy, R. Prohaska, K. Kelly, and M. Post, “Foothill Battery Electric Bus Demonstration Results,” NREL/TP-5400-65274, National Renewable Energy Laboratory, January 2016). https://www.nrel.gov/docs/fy17osti/67698.pdf

[lii] LA Metro. (2017). Contract 2016-0988 – Metro Board. https://boardagendas.metro.net/board-report/2016-0988/; LA Metro. (2017b). Contract 2017-0304 – Metro Board. https://boardagendas.metro.net/board-report/2017-0304/

[liii] The Guardian. (2021, Feb.) Electric busmaker Arrival schedules first UK road trial. https://www.theguardian.com/business/2021/feb/21/electric-busmaker-arrival-schedules-first-uk-road-trial

[liv] Quarles, Neil, Kara Kockelman, and Moataz Mohamed. (2020.) “Costs and Benefits of Electrifying and Automating Bus Transit Fleets.” Page 6. Sustainability. https://doi.org/10.3390/su12103977; National Renewable Energy Laboratory, U.S. Department of Energy Office of Energy Efficiency & Renewable Energy. (2020.) Financial Analysis of Battery Electric Transit Buses. Technical Report. Page 8. https://afdc.energy.gov/files/u/publication/financial_analysis_be_transit_buses.pdf

[lv] Bloomberg New Energy Finance. (2018, March). Electric Buses in Cities: Driving Towards Cleaner Air and Lower CO2. Page 21. https://data.bloomberglp.com/professional/sites/24/2018/05/Electric-Buses-in-Cities-Report-BNEF-C40-Citi.pdf

[lvi]  Bloomberg New Energy Finance. (2018, March). Electric Buses in Cities: Driving Towards Cleaner Air and Lower CO2. Page 22. https://data.bloomberglp.com/professional/sites/24/2018/05/Electric-Buses-in-Cities-Report-BNEF-C40-Citi.pdf

[lvii] Green Tech Media. (2019.) Proterra Rolls Out $200 Million Electric Bus Battery Leasing Program With Mitsui: Electric buses require more upfront investment than their diesel counterparts. Or at least they used to. https://www.greentechmedia.com/articles/read/proterra-rolls-out-bus-battery-leasing-program-with-mitsui

[lviii] This calculation is derived by taking the cost of an electric bus and subtracting it by the cost of batteries ($700,000-$196,000=$504,000).

[lix] Government and External Affairs Department, New Jersey Transit, personal communication, August 2020.

[lx] Maloney, P. (2019, October 17). Electric buses for mass transit seen as cost effective. American Public Power Association. https://www.publicpower.org/periodical/article/electric-buses-mass-transit-seen-cost-effective

[lxi] California Environmental Protection Agency. Air Resources Board. (2015). Technology Assessment: Medium-and Heavy-Duty Battery Electric Truck and Buses. Page V-9. https://ww2.arb.ca.gov/sites/default/files/classic//msprog/tech/techreport/bev_tech_report.pdf

[lxii]M.J. Bradley & Associates LLC. (2020). Battery Electric Bus and Facilities Analysis. Milwaukee County Transit System. https://www.mjbradley.com/sites/default/files/MTSElectricBusFinalReportFINAL15jan20_0.pdf;  King County Metro Transit. (2017). Feasibility of Achieving a Carbon-Neutral or Zero Emission Fleet. King County Metro; Stantec Consulting Services Inc. (2020, October 13). https://kingcounty.gov/~/media/elected/executive/constantine/news/documents/Zero_Emission_Fleet.pdf; and University of Massachusetts Amherst. (2017). Zero-Emission Transit Bus and Refueling Technologies and Deployment Status. Massachusetts Department of Transportation. These are a few studies that show how transit authorities are using a mixed electric bus charging infrastructure.

[lxiii] King County Metro Transit. (2017). Feasibility of Achieving a Carbon-Neutral or Zero Emission Fleet. King County Metro; Stantec Consulting Services Inc. (2020, October 13). https://kingcounty.gov/~/media/elected/executive/constantine/news/documents/Zero_Emission_Fleet.pdf

[lxiv] WSP. (2020, April). San Bernardino Countywide Zero-Emission Bus Study Master Plan. San Bernandino County Transportation Authority. Pg. 38. https://www.gosbcta.com/wp-content/uploads/2020/08/SBCTA-ZEB-Final-Master-Plan_04.24.20.pdf; Burns & McDonnell Engineering Company, Inc., ebusplan, & Greenlots, A Member of the Shell Group. (2019). In Depot Charging and Planning Study. Foothill Transit. http://foothilltransit.org/wp-content/uploads/2014/05/Burns-McDonnell-In-Depot-Charging-and-Planning-Study.pdf

[lxv]Proterra Northeast Regional Division of Sales, personal communication, August 2020.

[lxvi] Government and External Affairs Department, New Jersey Transit, personal communication, August 2020.

[lxvii] Aber, Judith. (2016, May). Electric Bus Analysis for New York City Transit. Columbia University. http://www.columbia.edu/~ja3041/Electric%20Bus%20Analysis%20for%20NYC%20Transit%20by%20J%20Aber%20Columbia%20University%20-%20May%202016.pdf

[lxviii] Chicago Transit Authority. (2019). Electric Buses. https://www.transitchicago.com/electricbus/#Benefits; Aber, Judith. (2016, May). Electric Bus Analysis for New York City Transit. Columbia University. http://www.columbia.edu/~ja3041/Electric%20Bus%20Analysis%20for%20NYC%20Transit%20by%20J%20Aber%20Columbia%20University%20-%20May%202016.pdf

[lxix] Sierra Club. (2020.) A Vision for Climate Leadership in Washington, DC: Seizing the Economic, Climate, and Public Health Benefits of Electrifying WMATA’s Transit Bus Fleet Page 12. https://www.sierraclub.org/sites/www.sierraclub.org/files/blog/WMATAReport_Final.pdf

[lxx] Environmental Defense Fund. (2020.) The true cost of carbon pollution. https://www.edf.org/true-cost-carbon-pollution; U.S. Environmental Protection Agency. Economics of Climate Change. https://www.epa.gov/environmental-economics/economics-climate-change

[lxxi] Aber, Judith. (2016, May). Electric Bus Analysis for New York City Transit. Columbia University. Page 19. http://www.columbia.edu/~ja3041/Electric%20Bus%20Analysis%20for%20NYC%20Transit%20by%20J%20Aber%20Columbia%20University%20-%20May%202016.pdf

[lxxii] This calculation is derived by multiplying the fleet of 2,665 buses and the greenhouse gas savings of $3,000.

[lxxiii] Tri-State Transportation Campaign, BlueWaveNJ, Clean Water Action, Environment New Jersey, New Jersey Policy Perspective, & New Jersey Sierra Club. (2020, April). Rail and Road Recovery. Tri-State Transportation Campaign. http://www.tstc.org/wp-content/uploads/2020/04/Rail-and-Road-To-Recovery-Final.pdf

[lxxiv] Advocacy Groups Urge NJ Turnpike Authority to Put the Brakes on $24B Capital Plan. (2020, April 28). NJ Spotlight. https://www.njspotlight.com/2020/04/advocacy-groups-urge-nj-turnpike-authority-to-put-the-brakes-on-24b-capital-plan/; CityLab, Bloomberg L.P., September 2018, “CityLab University: Induced Demand.” https://www.citylab.com/transportation/2018/09/citylab-university-induced-demand/569455/

[lxxv] NJ Spotlight News. (2020, March 3). Murphy’s Plan for NJ Transit: Where the Money’s Going to Come From. https://www.njspotlight.com/2020/03/murphys-plan-for-nj-transit-where-the-moneys-going-to-come-from/

[lxxvi] New Jersey’s Clean Energy Program. (2020). New Jersey’s Clean Energy Program. https://njcleanenergy.com/

[lxxvii] New Jersey Turnpike Authority. March 18, 2020 Public Hearings on 2020 Long-Range Capital Plan and Necessary Toll Adjustment on New Jersey Turnpike and Garden State Parkway. Pages 6-8. https://www.njta.com/media/5311/hearing-report-and-recommendation.pdf

[lxxviii] Politico New Jersey. (2020, September). NJ Transit budget may be sign board not functioning as reform law intended. https://www.politico.com/states/new-jersey/story/2020/09/18/nj-transit-budget-a-sign-board-not-functioning-as-reform-law-intended-1317170

[lxxix] Politico. (2020, September 30). Murphy signs a $32.7B budget that ‘will be there for the people of New Jersey.’ https://www.politico.com/news/2020/09/30/phil-murphy-budget-new-jersey-424274

[lxxx] Office of Legislative Services. (2020.) Legislative Fiscal Estimate. S2949. https://www.njleg.state.nj.us/2020/Bills/S3000/2949_E1.PDF

[lxxxi] Sheila Reynerston, New Jersey Policy Perspective. (2017.) Fairly and Adequately Taxing Inherited Wealth Will Fight Inequality & Provide Essential Resources for All New Jerseyans. https://www.njpp.org/publications/report/fairly-and-adequately-taxing-inherited-wealth-will-fight-inequality-provide-essential-resources-for-all-new-jerseyans/

[lxxxii] Transportation and Climate Initiative. (2021.) Memorandum of Understanding. https://www.transportationandclimate.org/sites/default/files/TCI%20MOU%2012.2020.pdf

[lxxxiii] Transportation and Climate Initiative. (2021.) Memorandum of Understanding. https://www.transportationandclimate.org/sites/default/files/TCI%20MOU%2012.2020.pdf

[lxxxiv] Union of Concerned Scientists. (2019, June). Inequitable Exposure to Air Pollution from Vehicles in the Northeast and Mid-Atlantic. https://www.ucsusa.org/resources/inequitable-exposure-air-pollution-vehicles?_ga=2.165707262.1575461946.1597037520-1621630665.1597037520

[lxxxv] Transportation and Climate Initiative Program. (2021, March 1). Summary of the Draft Model Rule. https://www.transportationandclimate.org/sites/default/files/Summary-of-TCI-P-Draft-Model-Rule-March-2021.pdf

[lxxxvi] Department of Environmental Protection. Frequently Asked Questions About the Federal Volkswagen Settlement and New Jersey. https://www.state.nj.us/dep/vw/faq.html

[lxxxvii] Department of Environmental Protection. Frequently Asked Questions About the Federal Volkswagen Settlement and New Jersey. Overview of Distribution of Mitigation Funds. https://www.state.nj.us/dep/vw/project.html

[lxxxviii] Department of Environmental Protection. Frequently Asked Questions About the Federal Volkswagen Settlement and New Jersey. https://www.state.nj.us/dep/vw/faq.html

[lxxxix] Federal Transit Administration. (2020). Fiscal Year 2020 Low or No-Emission (Low-No) Bus Program Projects. https://www.transit.dot.gov/funding/grants/fiscal-year-2020-low-or-no-emission-low-no-bus-program-projects

[xc] Federal Transit Authority. (2020) Grants for Buses and Bus Facilities Program. https://www.transit.dot.gov/bus-program

[xci] Larry Higgs, NJ Advance Media for NJ.com. (2020a, August 7). NJ Transit gets $15M federal grant to pave the way for electric buses. Nj. https://www.nj.com/news/2020/08/nj-transit-gets-15m-federal-grant-to-pave-the-way-for-electric-buses.html

[xcii] U.S. Department of Transportation. (2020.) About BUILD Programs. https://www.transportation.gov/BUILDgrants/about

[xciii] U.S. Department of Energy. (2016.) State Energy Resilience Framework. Prepared by Global Security Sciences Division, Argonne National Laboratory.  Page 2. https://www.energy.gov/sites/prod/files/2017/01/f34/State%20Energy%20Resilience%20Framework.pdf

[xciv] Bailey, L. (2020, October). Planning for a Climate Resilient Electric Bus Fleet. Tri-State Transportation Campaign. Page 10. http://www.tstc.org/wp-content/uploads/2020/09/09-29-2020_Resiliency-Report.pdf

[xcv] UC San Diego, Jacobs School of Engineering. (2018, April 5). A power player for San Diego. Press release. https://jacobsschool.ucsd.edu/news/release/2519

[xcvi] Maldonado, S. (2021, January 26). Environmentalists: Proposed PSE&G electric vehicle settlement won’t advance state’s goals. Politico PRO. https://www.politico.com/states/new-jersey/story/2021/01/26/environmentalists-proposed-pse-g-electric-vehicle-settlement-wont-advance-states-goals-1360277

[xcvii] Dutzik, Tony, & Friedman, Jamie. (2020). Renewables on the Rise. Environment America Research & Policy Center and Frontier Group. https://environmentamerica.org/feature/ame/renewables-rise-2020

[xcviii] New York Times. (2021, January 21).  ‘Notorious’ Port Authority Bus Terminal May Get a $10 Billion Overhaul. https://www.nytimes.com/2021/01/21/nyregion/port-authority-bus-terminal.html

[xcix] Utah Department of Environmental Quality. (2021). Monitoring Matters: How Air-Quality Monitoring Helps Utah’s Air. https://deq.utah.gov/air-quality/air-quality-monitoring-utah

[c] Josh Axelrod, NJ Advance Media for NJ.com & Larry Higgs, NJ Advance Media for NJ.com. (2020, December 31). A bus driver, a mechanic, a bridge operator. These 15 NJ Transit employees died from COVID-19. Nj. https://www.nj.com/community-news/2020/12/a-bus-driver-a-mechanic-a-bridge-operator-these-15-nj-transit-employees-died-from-covid-19.html

[ci] Center for Transportation and the Environment. (2019.) Zero Emission Bus Roadmap. In partnership with: SINGH + Associates, Inc. Page 66. https://www.cyride.com/Home/ShowDocument?id=9880

The “Whitening” of Camden’s Teachers

New Jersey is stronger when people of varied backgrounds, experiences, and perspectives work and learn together. For the state’s public education system, teachers and leaders of color play critical roles in ensuring equity. However, people of color are decreasingly represented in the teaching workforce. This problem is particularly acute in Camden, New Jersey, where the city now employs fewer Black teachers and more white teachers than it did two decades ago. The decline in Black teachers is largely attributed to charter and renaissance school expansion, where charters are hiring fewer teachers of color. This expansion has also resulted in a less experienced workforce, as charter and renaissance teachers have far less experience than Camden City School District teachers. While this is a major workforce equity problem, this is also a problem for students, as students of color benefit from having access to teachers of their race. This brief examines Camden schools, charter expansion, and the resulting shift of the whitening of Camden teachers.

Background: Camden’s Schools, Charter Expansion, and State Control

Recent reports of the likely closing of several schools in the Camden City School District (CCSD) will come as no surprise to anyone who has observed the city’s educational system over the past two decades.[1] Enrollment in CCSD has been declining for years, even as the overall population of students in publicly funded schools has changed little. Instead, and like other cities in New Jersey, CCSD has seen its enrollments drop due to the rapid growth of charter schools: publicly funded schools approved directly by the state and run by private, non-governmental organizations.

Camden’s charter sector, however, is unique: many of its students are enrolled in “renaissance” schools, a special type of charter school authorized by separate legislation that receives additional financial support.[2] Renaissance schools were introduced to Camden with the promise from their supporters that they would enroll all students within their given boundaries or “catchments.”[3] A State Auditor’s report in 2019, however, found that the renaissance schools were enrolling many students outside their catchments, even as students within them were put on waitlists.[4]

Renaissance and other charter school enrollments have become more prevalent in Camden over the last two decades. While the overall number of students in publicly funded schools has declined by less than one thousand students since 2000, the growth in charter and renaissance enrollments has left CCSD with 10,592 fewer students over the same period. 

Changes in Camden’s Teacher Workforce: Less Diversity, Less Experience

While there are several important consequences to the shift in enrollments from CCSD to charter and renaissance schools, one that is not often discussed is the change in the composition of the teacher workforce in Camden.[5] As CCSD enrollments have declined and charter/renaissance enrollments have increased, teaching positions in CCSD have been replaced by positions in charter/renaissance schools.

It is important to note that the decline in CCSD teaching positions preceded the state takeover of the district in 2013,[6] the year before the city’s first renaissance schools opened. Most of the decline occurred after 2006, when the state first appointed a fiscal monitor—who oversees and approves all operation, management, and staffing decisions— for the district.[7] The decline accelerated during the early years of the Christie administration; Governor Christie was well-known as a supporter of charter school expansion.[8]

The demographic composition of the CCSD teaching workforce is considerably different from the charter/renaissance workforce: charter teachers are less experienced and less likely to be Black. While the percentage of Black teachers in CCSD has declined in the last decade, it has always been higher than the same percentage in the charter/renaissance schools.

These two factors—fewer Black teachers in CCDS and a shift to more charter/renaissance teachers—have greatly impacted the overall Camden teaching workforce. Two decades ago, the majority of Camden’s teachers were Black; today, the majority are white.

In 1999, 52 percent of Camden’s teachers were Black; by 2019, only 30 percent were. In contrast, 38 percent of Camden’s teachers were white in 1999; 55 percent were in 2019. Changes in the percentage of Hispanic/Latinx teachers or of other races do not explain this remarkable shift. [9]

The changes in the Camden teacher workforce’s racial/ethnic profile have left Camden’s students with fewer teachers who look like them. In CCSD, 44 percent of students and 41 percent of teachers are Black. In charter schools, however, 31 percent of students are Black, but only 16 percent of teachers are. Similarly, 47 percent of renaissance students are Black, but only 27 percent of teachers are. The shift in the teacher workforce from CCSD to charter/renaissance schools, therefore, creates a greater racial mismatch between students and teachers across the entire city.

Black students in Camden are not the only students whose identities are underrepresented in the teacher workforce: the proportion of Hispanic/Latinx students in Camden is far greater than the proportion of Hispanic/Latinx teachers. This is true in both CCSD and the city’s charter sector. As NJPP notes in its report on educator training in New Jersey, there are significant barriers to entry for potential teachers of color in teacher preparation programs; the problem of teacher diversity, therefore, is hardly exclusive to Camden.[10]

The mismatch of teacher and student race and ethnicity in Camden has important consequences. As NJPP documents in its latest report on the teacher workforce in New Jersey, students of color benefit from having teachers of their own race in their schools.[11] This benefit has eroded, however, as more teaching positions close in CCSD and open in the charter schools.

Another notable change in Camden’s teaching workforce is the decrease in average educator experience. A Camden teacher had 14 years of total experience in 1997; today, they have less than 11 years. This change can almost entirely be attributed to the growth of charter schools. Although the average experience of charter and renaissance teachers has gone up slightly in recent years, charter teachers have far less experience on average than CCSD teachers.

The simplest explanation for charter school teachers’ lack of experience is that the schools do not retain staff nearly as long as CCSD. In the 2018-19 school year, 92 percent of teachers who worked in CCSD in 2017-18 returned. Contrast this with the 70 percent retention rate in the renaissance schools, or even lower rates in some of the charters.

Previous research on New Jersey’s charter sector suggests that some charter operators—including those who operate the renaissance schools—benefit from employing a staffing model that churns teaching staff. [12] Because teachers earn more in their later years, cultivating a less experienced staff allows these charters to operate at a lower per-pupil cost; the savings can be used to offer more competitive wages, which in turn allows for a longer school day. There is a question, however, as to whether this staffing model can be brought to a larger scale, as the supply of novice teachers in New Jersey is shrinking.[13]

Conclusion: Stemming the “Whitening” of Camden’s Teachers

There are at least two reasons why Camden should care about the changes in its teaching workforce. First, students of color benefit from having teachers of color in their schools. In Camden, this means policies should be in place to support the recruitment and retention of Black and Hispanic/Latinx teachers across all sectors: CCSD, charters, and renaissance schools.

Second, the policies that have led to fewer Black teachers in Camden’s schools have been established by the state and are not the result of local action. CCSD has operated under a state fiscal monitor since 2006 and under full state control since 2013. The plan to close CCSD schools and replace them with charter schools was developed by the Christie administration without local input.[14] The Urban Hope Act, which established renaissance schools, is a state initiative but has been confined solely to Camden.

The whitening of Camden’s teacher workforce is the result of policies imposed by outside forces. Yet these very policies have resulted in fewer jobs for Black teachers in a predominantly Black city.[15] The policymakers who have caused this shift have an immediate obligation to acknowledge the problem and propose solutions to address it.


End Notes

[1] April Saul, (1/8/21), WHYY. “‘How am I going to drop off my kids?’: Parents, stakeholders fret at proposed Camden school closures.” https://whyy.org/articles/how-am-i-going-to-drop-off-my-kids-parents-stakeholders-fret-at-proposed-school-closures-in-camden/

[2] https://www.state.nj.us/education/chartsch/renaissance/docs/2014UHA.pdf

[3] Georgie E. Norcross, III, (4/13/17), The Star-Ledger. “Working together has saved Camden’s schools | Opinion.” https://www.nj.com/opinion/2017/04/working_together_has_saved_camdens_schools_opinion.html

[4] Stephen M. Eells, Office of the State Auditor, New Jersey. (1/15/2019). City of Camden School District.https://www.njleg.state.nj.us/legislativepub/Auditor/341017.pdf

[5] Throughout this report, I refer to “teachers” as certificated staff who do not hold administrative positions. These staff include those who are not in instructional positions but provide student support, including counselors, occupational and physical therapists, nurses, librarians, speech therapists, and so on. “Teachers” in this report does not include those who do not hold a certificate, such as paraprofessionals, custodians, cleric workers, etc.

[6] John Mooney (6/6/2013). Nj Spotlight. “Camden Schools Takeover: Day One, and Counting” https://www.njspotlight.com/2013/06/13-06-05-camden-schools-takeover-day-one-and-counting/

[7] Winnie Hu (10/30/2006).The New York Times. “In New Jersey, System to Help Poorest Schools Faces Criticism.” https://www.nytimes.com/2006/10/30/education/30abbott.html

[8] John Mooney, (7/18/17). Nj Spotlight. “Christie’s Charter Legacy: A Clear Record of Growth.” https://www.njspotlight.com/2017/07/17-07-18-christie-s-charter-legacy-a-clear-record-of-growth/

[9] NJDOE data divides teacher race/ethnicity into seven categories: white, Black, Hispanic, Asian, Native American, Hawaiian Native, and two or more races. (See: https://www.nj.gov/education/data/cs/) The percentage of teachers in the last four categories totaled never rises above 4 percent in the data and is excluded from this analysis.

[10] Mark Weber (2020). New Jersey’s Shrinking Pool of Teacher Candidates. The New Jersey Policy Perspective: Trenton, NJ. https://www.njpp.org/publications/report/new-jerseys-shrinking-pool-of-teacher-candidates/

[11] Mark Weber (2019). In Brief: New Jersey’s Teacher Workforce, 2019. The New Jersey Policy Perspective: Trenton, NJ. https://www.njpp.org/publications/report/in-brief-new-jerseys-teacher-workforce-2019-diversity-lags-and-wage-gap-persists/

[12] Mark Weber (2019). Ten Important Facts About New Jersey Charter Schools… And Five Ways To Improve The New Jersey Charter Sector. New Jersey Education Policy Forum; New Brunswick, NJ.  https://njedpolicy.wordpress.com/2019/04/26/ten-important-facts-about-new-jersey-charter-schools-and-five-ways-to-improve-the-new-jersey-charter-sector/

[13] Mark Weber (2020). New Jersey’s Shrinking Pool of Teacher Candidates. The New Jersey Policy Perspective: Trenton, NJ. https://www.njpp.org/publications/report/new-jerseys-shrinking-pool-of-teacher-candidates/

[14] See: Mark Weber (5/2/2012). “NJDOE Coup D’Etat.” (blog post).  http://jerseyjazzman.blogspot.com/2012/05/njdoe-coup-detat.html

[15] US Census Bureau data, Camden, NJ, 2019: https://data.census.gov/cedsci/profile?q=ACSDP5Y2019.DP05%20Camden%20city,%20New%20Jersey&g=1600000US3410000 Camden’s population by race: White alone, 23.5%; Black or African American alone, 41.4%; Some other race alone, 27.6%, two or more races, 4.5%; Asian alone, 2.4%.

Parents are Essential Too: Supporting Working Families During the Pandemic

The wellbeing of New Jersey’s children and working parents — as well as the state’s recovery from COVID-19 — depends on families being able to balance work and caregiving. Even before the onset of pandemic, many New Jersey families struggled with this balancing act. Now, the current crisis has created untenable conditions for many families who face the additional pressures of unstable and unpredictable employment, schooling, and childcare.

Although lawmakers enacted several state and federal policies to support working families during the pandemic, many of these programs are neither universal nor permanent. As a result of underinvestment and piecemeal policymaking, many workers continue to face barriers to paid leave, job protections, adequate wages, quality and affordable childcare, and work stability and flexibility. This report examines the circumstances of New Jersey’s working parents, assesses the strengths and shortcomings of existing policies, and identifies solutions to improve conditions for parents, children, and employers.

Households with Children Face Disproportionate Barriers to Economic Security

New Jersey families with children faced disproportionately large economic challenges both before and during COVID-19, including poverty and the loss of employment and income. Prior to the pandemic, families with children under 18 were already more likely to live below the federal poverty level than families without children.[i] In 2019, approximately one in ten families with children in New Jersey lived in poverty.[ii] Now, almost a year into the pandemic, working families are falling further behind. Households with children are twice as likely (19 percent) to report that it was very difficult to cover usual expenses during the last seven days as households without children (9 percent), according to the most recent U.S. Census Bureau Household Pulse Survey (conducted between November 11 -23, 2020).[iii] In addition, while COVID-19 has caused unprecedented economic disruptions across the state, households with children in New Jersey were 23 percent more likely to report experiencing loss of employment income since the beginning of the state’s stay-at-home order in mid-March than families without children.[iv]

Low-Income, Black, and Latinx Workers are Least Likely to Work from Home

The ability to work from home has enabled many parents to practice social distancing while continuing to work during the pandemic. Not all employees, however, are able to telework. One key factor that influences whether an employee is able to work from home is occupational segregation. Because employment opportunities are shaped by systemic barriers to education and discrimination in hiring and promotion, ability to work from home varies by race and income.

Prior to the onset of COVID-19, only one in three workers was able to work from home. While approximately one in three Asian and white workers were able to telework, only one in five black workers and one in six Latinx workers were able to telework. In addition, high wage workers were six times as likely to be able to work from home as low wage workers.[v]

Racial and income disparities in teleworking that existed prior to the onset of the pandemic have been compounded during the current crisis, according to a survey that asked if any adults in a household substituted any work that was typically conducted in person with telework since mid-March. While over half (58 percent) of Asian respondents and nearly half (47 percent) of white respondents substituted some or all of their typical in-person work with telework, only one-third of Black (36 percent) and Latinx (30 percent) respondents transitioned to telework.[vi]

The ability to work from the safety of home during COVID-19 is most often afforded to workers who are the highest paid.[vii] At least one adult was able to transition to remote work during the pandemic in 79 percent of households earning over $200,000 per year and in 55 percent of households earning between $100,000 to $149,999 per year. In general, households with the lowest incomes are least likely to have transitioned to some or all telework due to COVID-19. Fewer than a quarter of households earning less than $50,000 per year had at least one adult who moved some or all their work to telework due to the pandemic. Accordingly, the households least able to bear the additional costs of childcare resulting from the COVID-19 pandemic are often those who need it most.

COVID-19 Intensifies Childcare Challenges

While the inadequacies and inequities in New Jersey’s childcare infrastructure did not begin with the COVID-19 pandemic, the current crisis has exacerbated and complicated childcare challenges. Approximately one-third (266) of New Jersey’s school districts began the 2020 school year with plans for all remote-learning, approximately half (395) had plans for hybrid models, and less than 10 percent (75) had plans for in-person learning.[viii] In addition, families have had to navigate diverse and changing conditions among childcare providers and schools in New Jersey. Because of the constantly evolving nature of the ongoing public health emergency, facility closures often come with little or no advanced notice, leaving families scrambling to plan childcare. Even among parents who can telework, many now face the dual responsibility of working while providing childcare or overseeing remote learning due to a loss of childcare or shift to online learning. For families with children that require ongoing supervision, juggling work and childcare duties simultaneously is an impossible task.

Before the onset of COVID-19, childcare was already a challenge for many working families. Most children (73 percent) in New Jersey live in households where all parents work.[ix] For single parents, the majority of whom are women, the difficulties of managing childcare and work are especially acute. The vast majority of single parents work – 90 percent of single fathers and 84 percent of single mothers.[x]

New Jersey is home to nearly 600,000 young children and infants, as well as 1.3 million school aged children and teens (between the ages of 6 and 17).[xi] In 2019, almost half (46 percent) of children under the age of six in New Jersey lived in a childcare desert, or a place where the number of children is more than three times the licensed childcare capacity.[xii] In addition to inadequate and inequitable childcare availability, childcare is not affordable for many low- and moderate-income families. New Jersey ranks as the fifteenth most expensive state in the country for childcare costs. The average cost for one year of care for a four-year-old in New Jersey is $10,855. Infant care is even more costly for New Jersey’s families, with an average annual cost of $12,988 per year.[xiii]

Insufficient affordable and quality childcare not only harms children, but also pushes parents – especially mothers – out of the workforce. Accordingly, lack of access to childcare is not only a problem for families with children, as it also hurts employers and New Jersey’s broader economy. Over 300,000 adults in New Jersey reported that they could not work because they had to care for children not in school or daycare in November 2020, according to the Census Bureau’s Household Pulse Survey.[xiv]  Similarly, in a poll of over 900 parents of infants and toddlers in New Jersey, 14 percent of parents reported that they left their jobs to manage childcare and 17 percent reported that they were forced to reduce their work hours.[xv]

Surveys of New Jersey residents suggest that the current crisis has had a particularly large toll on working mothers, low-income parents, and Black and Latinx parents. Among parents of children under the age of three in New Jersey, women (19 percent) were six times more likely to report that they had left their jobs to manage childcare since the onset of COVID-19 than men (three percent).[xvi] In an October 2020 poll of parents with children in New Jersey public schools, low-income Black and Latinx parents were 1.5 times more likely than parents overall to either take time off from work or leave their job to stay at home when their child is not in school (22 percent vs. 14 percent).[xvii]

State lawmakers have taken some steps to improve access to and stabilize childcare during COVID-19, but more must be done. For example, the New Jersey School-Age Tuition Assistance Program provides financial support for care for school-aged children engaged in remote learning due to COVID-19. To participate in this program, families must have a gross household income less than $150,000 per year. In addition, the childcare provider must be licensed or registered, which excludes families who rely on care from a relative.[xviii] While this program has been helpful for many households with school-aged children, it is temporary – the program is scheduled to expire on December 30th, 2020.

As COVID-19 infection rates remain high, uncertainty and fluctuation around school and daycare statuses is likely to continue to pose a significant challenge. [xix] In addition to extending and expanding programs that increase childcare affordability, a greater commitment of public resources is needed to create lasting, meaningful reform in the state’s childcare system to promote childcare availability and quality for all families. With structural improvements and adequate and equitable investments, the state can build a stronger childcare system that better supports the wellbeing of New Jersey’s children and working families as well as the state’s recovery from the current crisis.

Federal Expanded Leave Programs Lack Inclusivity and Longevity

The federal and state governments’ patchwork policy response to the pandemic has partially and temporarily improved conditions for some working parents. However, the gaps in some federal and state policies neglect to fully address the needs of workers and children. Because workers’ ability to take leave to care for a child depends on a variety of factors, including employer type and size, employer’s policies, and whether an employee has already taken leave, many parents remain in the difficult situation of juggling work responsibilities and caring for their children. Further, many of these programs are set to expire at the end of 2020. Amid unprecedented uncertainty around the status of schools and childcare, examining gaps in existing programs and taking steps to ensure universal coverage is more important than ever.

Families First Coronavirus Response Act (FFCRA)

Enacted in March 2020, the Families First Coronavirus Response Act (FFCRA) contains two key provisions for certain employers to provide paid leave to their employees for specified reasons related to COVID-19. The Emergency Paid Sick Leave Act (EPSLA) grants workers access to up to 80 hours (or the equivalent of two weeks of work for part-time workers) of partially paid leave if they are unable to work due to a COVID-19 quarantine order, illness, or their child’s COVID-19 related school / childcare closure.[xx] The Federal Emergency Family and Medical Leave Expansion Act (EFMLEA) provides employees who need to care for a child whose school or daycare is closed due to COVID-19 up to 12 weeks of job-protected partially paid leave .[xxi]

Under both of these provisions of the FFCRA, wage replacement for workers is tied to the reason for taking leave — wage replacement for employees who take leave for childcare is lower than for those who take leave due to their own illness. Employees who are unable to work because they are themselves quarantining or experiencing COVID-19 symptoms may take leave at their regular pay rate (up to a maximum of $511/day). Employees who take Emergency Paid Sick Leave to provide care are eligible for two-thirds of their regular rate of pay (maximum of $200/day). For employees who are taking Emergency Family and Medical Leave (EFML), the first two weeks may be unpaid (these weeks can be combined with other leave such as the EPSLA) and the remaining 10 weeks are paid at two-thirds of the employee’s regular pay rate (maximum of $200/day).[xxii]

While the leave available under the FFCRA has been helpful for many workers and employers, the program is set to expire on December 31, 2020. Even if the program is extended, not all workers are eligible to take leave under the FFCRA. Workers at large employers (over 500 employees) are excluded from all paid leave provisions under this law. As a result of this exemption, half of New Jersey’s private workforce (1.7 million workers) is automatically excluded from the FFCRA.[xxiii] This exclusion disproportionately limits access to paid leave for Black workers, who are overrepresented among workers at private firms with over 500 employees. While 50 percent of all private sector workers in New Jersey work for firms with over 500 employees, 62 percent of Black workers at private employers work for firms with over 500 employees.[xxiv]

Under the FFCRA, companies with fewer than 50 employees may qualify for exemption from the requirement to provide leave to care for a child out of school or childcare if these requirements would “jeopardize the viability of the business.”[xxv] In addition, employers may exclude healthcare providers and emergency responders from taking paid leave due to school closings or childcare unavailability.[xxvi] As a result of these two exemptions, an additional 34 percent of the private workforce (1.2 million employees) could potentially be denied paid leave for child care. The table below shows the estimated amount of private sector workers in New Jersey who are excluded from coverage under each exemption. In total, only 16% to 50% of New Jersey’s private workforce is guaranteed emergency paid leave for COVID-19 related childcare under the FFCRA.[xxvii] [xxviii]

The FFCRA’s interaction with other programs also poses challenges for many workers. Employees who need to take leave due to both COVID-19 related reasons and other circumstances are not eligible for additional leave under the Family and Medical Leave Act (FMLA). For example, an employee who is a new parent or had to take medical leave may have exhausted their FMLA leave earlier in the year would not be able to access this benefit. Similarly, workers who have taken leave under the FFCRA, but later need take leave because of another illness or caregiving need, do not have access to FMLA for the remainder of the year.

All Workers Deserve Flexibility, Paid Leave, and Protections

The transition to remote learning in New Jersey’s schools and changes to childcare availability due to COVID-19 has complicated the balancing act between work and caregiving for New Jersey’s working families. It is clear that New Jersey cannot wait for the federal government to act — Congress has yet to negotiate an extension of critical leave programs under the FFCRA that expire at the end of December — making it especially important that state lawmakers support the economic security, health, and wellbeing of working families. In a state where the majority of parents are workers, New Jersey cannot afford to push parents out of the workforce. While the challenges facing working parents in New Jersey are substantial, there are several steps that the state can take to immediately improve conditions for working families with children, including increasing flexibility, expanding paid leave, and strengthening protections for workers.

Increase Flexibility and Stability for Workers

The communities that have been hardest hit by COVID-19 are also those that are least likely to be able to work from home, least likely to have stable and predictable schedules, and least likely to be able to afford childcare.  In July 2020, state lawmakers introduced legislation that would prohibit employers from requiring employees to be physically present at work during the public health emergency if they can work remotely and have a school-aged child.[xxix] This is an important step and may help many parents who are able to perform their work remotely; however, for many workers, teleworking is not possible.

In addition to risking their health to perform in-person work, many workers in New Jersey continue to face inflexible, unpredictable, and unstable scheduling practices. These scheduling practices pose challenges to meeting and planning caregiving responsibilities.[xxx] Regulating scheduling practices for hourly workers to ensure that workers have advanced notice of their schedules, fair compensation, sustainable hours, and flexibility when they need it, would improve conditions for New Jersey’s working families.

Expand Paid Leave

Gaps in existing policies leave many New Jersey families without paid leave, making them more likely to lose income and face financial insecurity. Expanding access to paid leave during a public health emergency would help keep more New Jerseyans in the workforce and better accommodate the needs of workers who are sick or need to provide care. Given the exclusions in FFCRA and looming sunset date for these federal paid leave provisions, the state cannot afford to rely on the federal government to provide adequate paid leave to workers.

By making minor changes to existing state programs, New Jersey lawmakers can substantially improve access to paid leave, especially for workers caring for children due to school and childcare changes resulting from COVID-19. For example, expanding the state Earned Sick Leave law to provide for additional days and improved access to paid sick days during a public health emergency would allow more workers to be able to care for loved ones, maintain financial security, and remain in the workforce. In addition, New Jersey could expand eligibility for Family Leave Insurance (FLI) to parents who are ineligible for other paid leave programs and who are unable to work because they must care for a child at home due to a COVID-19 related school or daycare closures. This program could also be made more inclusive by expanding eligibility to include all workers who pay into the program, regardless of immigration status.

Strengthen Job Protections

New Jersey has taken several steps to improve access to job protections, yet far too many workers still refrain from taking leave out of fear of losing their job or retaliation from their employer. Near the onset of COVID-19, New Jersey lawmakers enacted legislation to prohibit employers from terminating or penalizing workers who have themselves contracted or are likely to have contracted an infectious disease and request to take time off work based on the recommendation of a licensed medical professional.[xxxi] Nevertheless, this measure does not provide any protection for workers who take leave due to school or childcare closures resulting from COVID-19.

New Jersey’s Family Leave Act (NJFLA) has been expanded to include care for a loved one due to COVID-19 and care for a child at home because of a public health emergency related closure of schools or places of care.[xxxii] Nevertheless, NJFLA remains limited in several ways. Notably, NJFLA does not apply to employers with fewer than 30 employees, and the protections only cover employees who have been at their job for at least one year and have worked 1000 hours. On the other hand, under the FFCRA, there is no required duration of employment as part of the EPSLA provision and for EFMLEA, workers only have to be employed for 30 calendar days. Since both provisions of the FFCRA expire at the end of 2020, state lawmakers can partially address the gap that will be created in the absence of Congressional action by extending NJFLA to workers who have been employed for 30 days (as opposed to one year) when taking leave during a public health emergency.

Parents are Essential Too

During a health and economic crisis that has upended school, childcare, and work arrangements, ensuring that employees can take time off when they are sick or need to care for their loved ones is essential. Access to workplace flexibility, comprehensive paid leave, and job protections are not only important for the wellbeing of families with children, but also for public health and the economy. By making meaningful changes to promote the wellbeing of New Jersey’s workers who have disproportionately borne the harm caused by the current pandemic, New Jersey will not only be able to have a stronger and more equitable recovery from COVID-19, but also be better prepared for future crises.


End Notes

[i] The Census Bureau considers families with a total money income (before taxes) less than the family’s poverty threshold to be in poverty. For example, the 2019 poverty threshold for a family with one adult and one child was $17,622. For a family with two adults and two children, the poverty threshold was $25,962. To access poverty threshold tables, see https://www.census.gov/data/tables/time-series/demo/income-poverty/historical-poverty-thresholds.html .

[ii] United States Census Bureau. American Community Survey. 2019 1-Year Estimates. Table S1702: Poverty Status in the Past 12 Months of Families. https://data.census.gov/cedsci/table?q=poverty%20child&g=0400000US34&tid=ACSST1Y2019.S1702&hidePreview=false

[iii] United States Census Bureau. (2020) Household Pulse Survey. Week 19. Spending Table 1: Difficulty Paying Usual Household Expenses in the Last 7 Days, by Select Characteristics: New Jersey. https://www.census.gov/data/tables/2020/demo/hhp/hhp19.html

[iv] United States Census Bureau. Household Pulse Survey. Week 19. Employment Table 1. Experienced and Expected Loss of Employment Income, by Select Characteristics: New Jersey https://www.census.gov/data/tables/2020/demo/hhp/hhp19.html

[v] Gould, Elise and Hedi Shierholz. 2020. “Not everybody can work from home.” Economic Policy Institute. https://www.epi.org/blog/black-and-hispanic-workers-are-much-less-likely-to-be-able-to-work-from-home/

[vi] United States Census Bureau. 2020. Household Pulse Survey: Week 19. Transportation Table 1. Teleworking during the Coronavirus Pandemic, by Select Characteristics: United States. https://www.census.gov/data/tables/2020/demo/hhp/hhp19.html

[vii] United States Census Bureau. Household Pulse Survey: Week 19. Transportation Table 1: Teleworking During the COVID-19 Pandemic, by Select Characteristics. https://www.census.gov/data/tables/2020/demo/hhp/hhp19.html

[viii] Mooney, John and Colleen O’Dea. (September 2020). “NJ Schools Reopen: What Districts Are Remote, In-Person, or Hybrid?” NJ Spotlight News. https://www.njspotlight.com/2020/09/nj-schools-reopen-plan-list/

[ix] United States Census Bureau. American Community Survey 2019: ACS 1-Year Estimates. Table DP03: Selected Economic Characteristics. https://data.census.gov/cedsci/table?q=parents%20employment&g=0100000US_0400000US34&tid=ACSDP1Y2019.DP03&hidePreview=false

[x] Due to limitations in the data, gender identities of the total population of parents could not be fully accounted for here. Please note that transgender and gender nonconforming people, among others, are often made invisible by data.

[xi] American Community Survey. 2019 1-Year Estimates. “Age of Own Children Under 18 Years in Families and Subfamilies by Living Arrangement by Employment Status of Parents”. https://data.census.gov/cedsci/table?q=employment%20children&g=0100000US_0400000US34&tid=ACSDT1Y2019.B23008&hidePreview=true

[xii] Center for American Progress. “Early Learning Factsheet 2019 – New Jersey”. https://cdn.americanprogress.org/content/uploads/2019/09/12071433/New-Jersey.pdf

[xiii] Economic Policy Institute. October 2020. “The cost of childcare in New Jersey”. https://www.epi.org/child-care-costs-in-the-united-states/#/NJ

[xiv] United States Census Bureau. Household Pulse Survey: Week 19. Employment Table 3. Educational Attainment for Adults Not Working at Time of Survey, By Main Reason for Not Working and Paycheck Status While Not Working. https://www.census.gov/data/tables/2020/demo/hhp/hhp19.html

[xv] Fairleigh Dickinson University. September 30, 2020. “Poll: New Jersey Working Parents Face Child Care Challenges Due to COVID-19” https://view2.fdu.edu/publicmind/2020/200930/index.html

[xvi] Fairleigh Dickinson University. September 30, 2020. “Poll: New Jersey Working Parents Face Child Care Challenges Due to COVID-19” https://view2.fdu.edu/publicmind/2020/200930/index.html

[xvii] Global Strategy Group. November 17, 2020. “Parents’ Survey Identifies Stark Racial and Income Disparities This Fall Semester” https://njchildren.org/wp-content/uploads/2020/11/NJ-Public-School-Parents-Memo-Updated-F11.16.20.pdf

[xviii] New Jersey Department of Human Services. ”COVID-19 Childcare.” https://www.childcarenj.gov/COVID19

[xix] New Jersey Department of Health. 2020. “New Jersey COVID-19 Dashboard.” https://covid19.nj.gov/

[xx] U.S. Department of Labor. (2020) “Temporary Rule: Paid Leave Under the Families First Coronavirus Response Act.” https://www.dol.gov/agencies/whd/ffcra

[xxi] U.S. Department of Labor. (2020) “Temporary Rule: Paid Leave Under the Families First Coronavirus Response Act.” https://www.dol.gov/agencies/whd/ffcra

[xxii] U.S. Department of Labor (2020). “Families First Coronavirus Response Act: Employee Paid Leave Rights.” https://www.dol.gov/agencies/whd/pandemic/ffcra-employee-paid-leave

[xxiii] U.S. Census Bureau. (2020). Quarterly Workforce Indicators (1990-2018). Washington, DC: U.S. Census Bureau, Longitudinal-Employer Household Dynamics Program. https://qwiexplorer.ces.census.gov.

[xxiv] Ibid.

[xxv] U.S. Department of Labor. Families First Coronavirus Response Act: Employee Paid Leave Rights. https://www.dol.gov/agencies/whd/pandemic/ffcra-employee-paid-leave

[xxvi] Paid Leave Under the Families First Coronavirus Response Act. (2020). 85 FR 19326. https://www.federalregister.gov/documents/2020/04/06/2020-07237/paid-leave-under-the-families-first-coronavirus-response-act

[xxvii] U.S. Census Bureau. (2020). Quarterly Workforce Indicators (1990-2018). Washington, DC: U.S. Census Bureau, Longitudinal-Employer Household Dynamics Program. at https://qwiexplorer.ces.census.gov. These estimates are based on an average of quarterly data from 2018, which is the latest year for which data are available.

[xxviii] U.S. Census Bureau. (2020). Quarterly Workforce Indicators (1990-2018) [computer file]. Washington, DC: U.S. Census Bureau, Longitudinal-Employer Household Dynamics Program. https://qwiexplorer.ces.census.gov

[xxix] New Jersey 2019th Legislature. Assembly No. 4462. https://www.njleg.state.nj.us/2020/Bills/A4500/4462_I1.HTM

[xxx] Schneider, Daniel, Kristen Harknett, and Megan Collins. (2020) Working in the Service Sector in New Jersey. https://shift.hks.harvard.edu/working-in-the-service-sector-in-new-jersey/

[xxxi] New Jersey Public Law 2020, Chapter 9. https://www.njleg.state.nj.us/2020/Bills/PL20/9_.PDF

[xxxii] New Jersey P.L. 2020, Chapter 23. https://www.njleg.state.nj.us/2020/Bills/PL20/23_.PDF

School Funding in New Jersey: A Fair Future for All

This is Part 1: Series Overview and a Plan for the Future of School Funding in New Jersey: A Fair Future for All. Click the links below to access Parts 2 through 5.

Part 2: School Resources, Revenue, and Taxes

Part 3: The School Funding Reform Act – 2020 Update

Part 4: The Cost of an Adequate Education in New Jersey

Part 5: Inequities Within School Districts


NJPP’s second annual report on the state of school funding in New Jersey arrives at a time of unprecedented challenges, both fiscal and educational. The COVID-19 pandemic has forced school districts to radically change how they deliver instruction, while the ensuing economic downturn has created a fiscal crisis for both the state and its local school districts. Ironically, the looming threat of cuts to education spending comes at a time when there is a stronger research consensus than ever about the role of funding in student academic achievement: Adequate and equitable school funding is the necessary precondition for student success. If New Jersey is to see its students thrive through this emergency, it must find a way to ensure that all children, no matter where they live or what learning challenges they face, have access to schools that are adequately funded.

This series, School Funding in New Jersey: A Fair Future for All, provides an in-depth look at the current state of school finance in New Jersey: how the state got here, what the consequences have been for our students, and how the state should proceed in the face of the current crisis.

In Summary

Principles
  • School districts enrolling more children from low-income families and more English language learners need more resources to equalize educational opportunity. These are the same districts, however, that are at a disadvantage in raising revenues from the onset, because their tax capacity is lower.
  • A state school funding system, therefore, should drive more funding to the districts that need it most, but have the least capacity to raise it themselves. In other words, statewide school funding should be progressive.
  • Acknowledging the revenue inequities that arise from property taxation, property taxes remain an important revenue source because they are less volatile and, therefore, less likely to decline in an economic slump.
  • State aid to schools is tax relief: it makes state and local taxes more progressive because it distributes the tax burden more equitably.
  • Fewer resources mean fewer staff per student and less-competitive wages for staff. Districts with proportionally more students requiring additional support, including those who are economically disadvantaged, English language learners, or children with disabilities, benefit from having these resources.

Key Findings
  • Compared to other states, New Jersey still makes a strong effort to fund its schools (“effort” being the proportion of the state’s economy dedicated to K-12 education). But New Jersey has made less effort to fund schools after the recession of 2009 than it did before; the state has never made up for the losses in school revenues following the recovery. Consequently, New Jersey school districts are in a worse fiscal position now than they were before the last recession.
  • New Jersey has gone backwards in school funding progressiveness over the past decade. For the first time in decades, New Jersey’s highest-poverty schools are spending less than its lowest-poverty schools. This said, New Jersey’s underlying school funding formula is more progressive than in many other states.
  • New Jersey is not a tax-and-spend outlier: it ranks 31st in the nation on own source revenues, and 8th in the nation on state and local taxes (as a percentage of income). New Jersey has more progressive state and local taxes than its neighbors; however, the wealthiest residents of New Jersey still pay less in taxes than those in the middle. New Jersey’s state school aid system is one of the reasons its taxes are less regressive.
  • New Jersey’s School Funding Reform Act (SFRA) is designed to drive more funding to districts with greater needs but lower tax capacity. But SFRA spending targets were set based on older and lower standards for student learning; to reach the new, higher standards, students and schools will need more resources. In addition, SFRA has features that drive aid toward districts that are already spending well above adequacy targets. For example: the funding formula allocates some state aid for special education to every district regardless of whether it spends above its adequacy target. The result is that the wealthiest districts with the greatest capacity to raise their own revenues still receive funding under SFRA.
  • More school districts are falling below their spending targets in 2019 than they were in 2010, the first year of SFRA. This is because many districts have not received the state aid they need, and some districts are not making their local required effort to fund their schools. The students in underfunded districts are more likely to be English language learners and come from low-income families. Research shows that these students need additional resources to achieve equal educational opportunity.[1] The SFRA formula was designed specifically to address this reality; continually underfunding these districts, therefore, undermines the primary goal of the law.
  • Under-spending districts – those with current spending below their SFRA specified adequacy targets – have higher concentrations of Black and Latinx students, and fewer teachers per 100 students. Many of these districts were not Abbott districts: they have never enjoyed the extra funding that came to districts that were party to the Abbot
  • The Governor’s budget for this year – released before the pandemic – was moving more state aid toward traditionally underfunded districts, although not enough to make up for historical funding gaps.
  • Analysis from our National Education Cost Model (NECM) shows New Jersey spends more than other states on schools; consequently, the state’s outcomes are higher than other states. Yet there are some districts in New Jersey, serving proportionally more students in economic disadvantage, that do not spending enough to meet the modest goal of national average outcomes.

Recommendations
  • Given the economic impact of the current pandemic and the increased costs of operating schools safely, all of New Jersey’s education stakeholders must unite and press for federal aid for schools. In addition, the state must consider raising additional revenues from its wealthiest residents, who pay less in taxes proportionally than middle-class residents.
  • In the face of the coming economic downturn, New Jersey should maintain and enhance the features of its school aid system that promote school funding progressiveness while decreasing tax regressiveness.
  • If cuts in state aid need to be made this year, New Jersey should first target the aid flowing to high-tax capacity districts, including categorical aid that is allocated outside of the adequacy formula.
  • If cuts in state aid need to be made, it is better to apply those cuts as a share of school district budgets, and not as a percent of state aid. Cutting aid as a share of aid will harm the highest-poverty, lowest-capacity districts more – those that are more dependent on aid to begin with.
  • SFRA spending targets should be recalibrated to align with new, higher standards; currently, they are too low, as they were based on previous, less rigorous outcome goals. Recalibration of the formula can occur without legislative change, a primary objective of the three-year Educational Adequacy Reports.
  • Judicial actions are not enough to ensure all of New Jersey’s students receive adequate funding: the state must take legislative and administrative actions to resolve the underfunding of many of its school districts, particularly those that do not have standing under the Abbott
  • New Jersey should stem the increase in the number of small, autonomous school districts, which tend to be less efficient than larger districts.
  • The state should conduct analyses of within-district spending differences, not local districts. These analyses should take into account drivers of cost differences such as special education, student characteristics, grade levels, and school type (magnet, charter, etc.). The methods described in this report will provide reasonable, actionable information for schools to more equitably allocate resources.


School Funding in New Jersey: An Overview

Years of research confirm an inescapable fact: Equitable and adequate funding is a prerequisite condition for providing a quality elementary and secondary education system. In past decades, when school funding has been increased students have benefited from those increases, demonstrating better outcomes in a range of educational measures.[2] Conversely, when school funding has been cut, students have suffered the consequences. Several recent studies reveal the adverse effects of the Great Recession of 2008 on student achievement.[3] Unfortunately, while adequate school funding is necessary for student success, public school systems across the country are currently bracing for an unprecedented economic recession resulting from the COVID-19 pandemic. Worse, most of these school systems, including schools in New Jersey, have still not fully recovered from the drastic cuts in school funding caused by the Great Recession.

NJPP’s first annual report on the state of New Jersey’s School Funding Reform Act (SFRA), released in 2019, addressed the first decade of the implementation of SFRA (2008 to 2018), the effects of the great recession on SFRA, and the failure of the state to fully recover and fund SFRA as designed.[4] As of that report, New Jersey had still not fully funded its school aid formula, and many districts faced significant gaps between their current spending levels and spending levels estimated in the formula as needed to achieve desired outcomes. Most of these spending gaps were a function of school districts failing to receive sufficient state aid because the state failed to fully fund its own formula. But some other districts fell below their “adequacy” targets because those districts failed to provide their full local contribution. Notwithstanding minor technical changes to the formula recommended in our first-year report[5] that have not been addressed, the long-term issues remain the same. New Jersey must both move toward fully funding the formula as it stands, while simultaneously considering the recalibration of that formula to today’s outcome goals and standards, as well as an increasingly diverse student population.

And yet New Jersey faces a severe fiscal crisis in the days ahead. The shock of the sudden economic shutdown will undoubtedly affect school budgets for years to come. Tax revenues will be lower as activity slumps, even as the state will have new public health spending obligations as it manages the effects of the pandemic. At the same time, it is impossible to imagine New Jersey making a meaningful recovery without adequately funded schools. A well-educated populace is the backbone of a strong economy, particularly in New Jersey, with its high rates of college attainment.[6] The state must not abandon its constitutional obligation to provide a “thorough and efficient system of free public schools” for its children; in fact, it will likely have to increase spending on schools given the realities of COVID-19. As the authors of this report have noted elsewhere:

Due to the COVID-19 pandemic, public schools will likely experience even greater revenue losses in the coming years than they did during the Great Recession. Further, it appears that safely reopening schools in the fall of 2020 will itself be costly. Much smaller class sizes will be required to meet social-distancing guidelines and contain the spread of the coronavirus; this, in turn, will require hiring additional personnel, finding new classroom space, and perhaps creating staggered schedules. It will mean more instructional hours for teachers, more staff hours spent cleaning and sanitizing facilities, and more complicated bus routes. Schools will have to budget for additional time and effort from maintenance and operations staff, food service workers, and other support positions. Nursing and other medical services — already inadequate in many schools (Willgerodt, Brock, & Maughan, 2018) — will need to be improved. And, to ensure equitable internet access, districts will have to redouble their investments in broadband and portable computers. Finally, since learning losses due to this spring’s school closures are likely to be most severe for students who live in poverty (Herald, 2020; Rothstein, 2020), schools in low-income neighborhoods will face especially daunting challenges come September. In short, we can expect the costs associated with reopening schools to be significantly greater this fall than in previous years, particularly in high-poverty schools and districts.[7]

Never has New Jersey been in such need of good school funding policy, grounded in high-quality research and sound analyses, that balances the needs of New Jersey’s children – especially its most disadvantaged children – with the state’s current fiscal realities. This series of reports strives to clarify the issues before the state regarding school funding by explaining where New Jersey is currently regarding K-12 education spending, how it arrived here, and the consequences of its school funding choices. This research lays the foundation for a school funding plan, as presented below.

Series Summary

Part 2: School Resources, Revenues, and Taxes

This report focuses on two of the three core indicators of statewide school funding fairness and effectiveness: effort and progressivity. Effort is a measurement of how much of a state’s economic capacity is directed toward K-12 education. Progressivity measures how much more (or less) a state’s neediest school districts receive relative to its most affluent. Compared to other states, New Jersey makes a strong effort to fund its schools: it devotes more of its economic capacity to education funding than most other states. Unfortunately, New Jersey decreased its share of economic capacity allocated to elementary and secondary school funding since the last recession. New Jersey’s high-poverty districts have suffered the greatest consequences of these reductions. Even though New Jersey exerts high effort relative to other states, it made less effort to fund schools after the Great Recession of 2009 then it did before. The state never made up for these losses in school revenues following the recovery; consequently, New Jersey has lost its position as the leader in progressive financing of schools.

New Jersey’s effort to fund schools is directly tied to its taxation system. Complaints about all taxes are a regular feature of political debates in New Jersey; however, New Jersey is not a tax-and-spend outlier. The state ranks 31st in the nation on own source revenues, and 8th in the nation on state and local taxes (as a percentage of income).[8] New Jersey also has less regressive state and local taxes than its neighbors: while the wealthiest residents still pay less in state and local taxes than those in the middle, New Jersey’s overall tax system does put more of the tax burden on its wealthiest citizens compared to many other states. An important reason for this relative progressiveness in taxes is the New Jersey school aid system. State aid to schools is tax relief: it makes state and local taxes more progressive because it distributes the tax burden for schools more equitably. New Jersey’s state school aid system is one of the primary reasons its taxes are less regressive here than they otherwise would be.

There are a multitude of problems with property taxation for local public goods and services, including schools. They are inequitable, both in terms of the revenues they generate and in terms of how they fall on local taxpayers. They tend to be regressive, with low income taxpayers paying a larger share of their income in property taxes. Many of these disparities are derived from over a century’s worth of manipulation of real estate markets, often with the primary goal of racial exclusion of home ownership in suburbs and orchestrated urban racial isolation through placement of low-income housing projects. Add to this the distortions in local tax rates created by placement of high value, though undesirable, industrial and utility properties.

But there’s one undeniable truth about revenues from property taxes that make it difficult, if not implausible, to eliminate them altogether from the revenue portfolio for schools: property tax revenues are far more stable than income or sales tax revenues. Fiscal planning for local public school districts, including maintenance of an equitable and adequate system of schooling, requires a balanced revenue portfolio inclusive of stable sources. The goal, moving forward, should be to identify the best strategies and creative policy options for taking advantage of the stability of property tax revenues while mitigating the inequities they have historically yielded.

While New Jersey is moderately better than most states at progressively funding its schools – driving funding where student needs are greatest and tax capacity is lowest – for the first time in decades, New Jersey’s highest-poverty schools are spending less than its lowest-poverty schools. This slide toward regressive funding has real and educationally meaningful consequences: New Jersey’s least affluent schools have fewer teachers per student and less competitive teacher salaries than they did before the recession of 2009.

In the face of an economic slump, federal aid for schools is critically important for all other states to operate safe and healthy schools in the coming years. New Jersey must also consider additional state taxes, targeted to its wealthiest residents, who still pay proportionally less than the state’s middle class.[9] If adequate federal and state aid isn’t forthcoming, however, New Jersey may be forced to consider cuts in state aid. In the previous recession, New Jersey (unlike other states) chose to make cuts based on a percentage of school budgets, and not on a percentage of state aid. This was a better – though still imperfect – approach that caused less harm to districts serving the most disadvantaged students. This report includes a simulation of cuts using both approaches; while neither is ideal, the harm to the districts enrolling students in the highest poverty quintile is clearly less when cuts are made based on school budgets.

Part 3: The School Funding Reform Act – 2020 Update

New Jersey’s School Funding Reform Act (SFRA) is designed to drive more funding to districts with greater needs but lower tax capacity. These are districts with lower property values; consequently, they must have much higher taxes rates simply to raise equivalent funds for their local schools. Students in these districts are more likely to be English language learners (ELL) and come from low-income families: these are the students research shows need more resources to achieve equal educational opportunity. SFRA, therefore, makes school funding more fair for both taxpayers and students.

Providing more funding to districts with higher concentrations of ELL and lower-income students is a common feature of state aid formulas, backed by a large body of research. ELL students require teachers with particular skills and training, as well as appropriate instructional materials and assessments.[10] While the amount varies across state contexts, there is no doubt that extra resources are needed to provide ELLs with effective instruction.[11] Similarly, modern research confirms that additional resources for lower-income students – used to reduce class sizes, lengthen instructional time, and increase educator salaries – yields significant and positive results.[12]

Unfortunately, tracking the funding of SFRA shows the collapse of progressive funding in New Jersey over the past decade. More school districts are falling below their spending targets in 2019 than they were in 2010, the first year of SFRA. This is because many districts have not received the state aid they should, and some districts are not making their local required effort to fund their schools. A common feature of districts falling well below SFRA funding targets (more than $5,000) is that they serve predominantly Latinx and low-income student populations. Schools in districts with larger funding gaps have fewer certified staff per pupil, and have less competitive teacher wages for otherwise similar teachers.

New Jersey saw its largest gains in student achievement for economically disadvantaged students during the mid-2000s – the same time when funding to Abbott school districts was being scaled up. After the Great Recession, however, the state pulled back from its commitment to equitable education funding; consequently, gains for disadvantaged students stalled. In addition, student “growth” is lower, year-after-year, in districts with funding gaps compared to districts without. In recent years, schools in districts with larger funding gaps have lower student outcomes on statewide standardized tests, demonstrating just how important adequate school spending is.

The Governor’s budget for this year – released before the pandemic – was moving more state aid toward traditionally underfunded districts, although not enough to make up for historical funding gaps.[13] In addition, SFRA spending targets were set based on older and lower standards for student learning; they are likely to be insufficient for the state’s newer, more rigorous standards. Closing these spending gaps must be a priority for New Jersey, even in the face of another recession. Our statistical models suggest that closing the SFRA funding gap leads to substantial gains in student outcomes. Closing a spending gap by $1,000, for example, is able to offset about half the difference in math achievement associated with a 10 percentage point increase in a district’s share of low-income students.

In the face of the coming economic downturn, New Jersey should maintain and enhance the features of its school aid system that promote school funding progressiveness while decreasing tax regressiveness. New Jersey’s school funding system has features that drive aid to districts that are already overfunded and have high local taxing capacity. Some state aid for special education, for example, automatically goes to more affluent districts, regardless of those districts’ ability to raise local revenues for schools. If cuts in state aid need to be made this year, New Jersey should first target the aid flowing to these high-capacity districts, including categorical aid that is allocated outside of the adequacy formula.

If further cuts need to be made, it is better to make cuts based on school budgets, and not simply cut overall state aid. Cutting school budgets will still harm the highest-poverty districts, but less than cutting state aid. Judicial actions are not enough to ensure all of New Jersey’s students receive adequate funding: the state must take legislative and administrative actions to resolve the underfunding of many of its school districts, particularly those that do not have standing under the Abbott rulings. In addition, SFRA spending targets should be recalibrated to align with new, higher standards; currently, they are too low, as they were based on previous, less rigorous outcome goals.

Cutting State Aid to Schools Is Always Harmful – But There Are Less Harmful Ways To Cut

Scenario Poverty Quintile Local per Pupil


State per Pupil Cut per Pupil Total per Pupil After Cut
Baseline 1-Lowest $9,020 $1,942 $10,962
2-Low $8,375 $2,372 $10,746
3-Middle $7,512 $2,953 $10,466
4-High $6,161 $3,935 $10,096
5-Highest $2,623 $8,166 $10,789
Cut 12 percent of State Aid


More harmful to high-poverty
school districts.

1-Lowest $9,020 $1,709 $233 $10,729
2-Low $8,375 $2,087 $285 $10,461
3-Middle $7,512 $2,599 $354 $10,111
4-High $6,161 $3,463 $472 $9,624
5-Highest $2,623 $7,186 $980 $9,809
Cut 5 percent of Per Pupil Revenue


Less harmful to high-poverty
school districts.

1-Lowest $9,020 $1,393 $548 $10,414
2-Low $8,375 $1,834 $537 $10,209
3-Middle $7,512 $2,430 $523 $9,943
4-High $6,161 $3,430 $505 $9,591
5-Highest $2,623 $7,626 $539 $10,250
Part 4: The Cost of an Adequate Education In New Jersey

This report turns the focus to adequacy: whether schools have the resources they need to meet a common educational goal. To evaluate New Jersey’s adequacy in school funding, we use the National Education Cost Model (NECM), a method that takes into account both school inputs (spending) and outputs (test scores) to determine whether districts and states are spending what they need to provide students with a quality education.

Our analysis shows New Jersey spends more than other states on its schools; consequently, New Jersey’s educational outcomes are better than those in other states. Yet there are some districts in New Jersey, serving proportionally more students in economic disadvantage, that do not spend enough to meet the modest goal of national average outcomes. These under-spending school districts have higher concentrations of Black and Latinx students, and fewer teachers per 100 students, than other districts that spend adequately. Many of these districts were not Abbott districts: they did not have standing under the earlier Abbott rulings and subsequently did not receive the benefits of increased spending during the pre-SFRA period.

Coupled with the analysis in Part III of this series, there is adequate evidence to show that even as New Jersey is relatively high spending and high achieving state, it has many districts that still do not have enough funding to achieve average educational outcome goals. New Jersey must acknowledge this limitation and fix its state aid formula so districts can meet the challenge of providing an adequate education for all students – even in the face of the post-pandemic fiscal crisis.

Some New Jersey school districts are particularly underfunded by multiple measures.

District SFRA Adequacy Budget (Incl. Spec Ed) NJDOE Adequacy Budget NJDOE Gap per Pupil SFRA Simulated Gap per Pupil NECM Gap per Pupil
EAST NEWARK BORO $22,464 $20,417 -$9,327 -$11,374 -$11,639
DOVER TOWN $21,346 $19,893 -$8,586 -$10,039 -$1,600
FAIRVIEW BORO $20,030 $18,821 -$8,746 -$9,955 -$7,687
GUTTENBERG TOWN $21,573 $19,876 -$7,965 -$9,662 -$6,250
BOUND BROOK BORO $21,473 $20,234 -$8,123 -$9,362 -$1,050
FREEHOLD BORO $20,112 $18,812 -$6,565 -$7,865 -$5,938
PROSPECT PARK BORO $19,155 $17,907 -$6,372 -$7,620 -$4,930
BELLEVILLE TOWN $20,151 $18,167 -$5,615 -$7,599 n/a
LINDENWOLD BORO $20,545 $19,282 -$6,101 -$7,364 -$1,541
CARTERET BORO $20,569 $18,733 -$5,406 -$7,242 n/a
WEST NEW YORK TOWN $21,821 $20,340 -$5,686 -$7,167 -$6,059
Part 5: Inequities Within School Districts

State school funding systems like New Jersey’s focus on allocating resources between districts. There has, however, been increasing federal focus on within-district funding inequities – differences in resources between schools within the same district. For a state like New Jersey, this is a secondary concern: most districts in the state are not large enough to have schools with significant differences in students or resources. In addition, the differences in resources that do exist within districts are often driven by variations in grade levels or special education populations. Attempts to measure within-district inequities in school funding must account for these differences.

Nevertheless, within-district inequities are a valid concern, and federal law requires New Jersey to collect data and conduct analyses. This report suggests methods for conducting these analyses: specifically, school disparity analysis should explore how resources differ between schools based on factors such as student disadvantage, English Language Learner (ELL) status, grade level, special education status, and school type (district, magnet, charter, etc.). The state should conduct these analyses, not local districts, as the state is more likely to develop the data gathering and analysis capacities needed. The methods we describe in this report will provide reasonable, actionable information for schools to more equitably allocate resources.

This report also notes that, despite evidence that school districts with lower enrollments and smaller schools are less efficient than larger ones (up to a point), New Jersey has expanded its number of small districts and schools, largely by expanding the number of autonomously operated charter schools. In a time of looming financial crisis, the state should assess whether expanding the number of small schools is fiscally prudent

A Plan for School Funding in New Jersey During and After the Pandemic

Now more than ever, equitable and adequate school funding is critically important for New Jersey’s future. Well-funded schools have always led to better student outcomes, greater individual opportunities, and a stronger economy. But in the days ahead, adequate funding will also be necessary to keep New Jersey’s students healthy and fully engaged in learning – even if students attend school virtually. As difficult as it may be, the state should set its sights on the future – a future that will only be bright if it includes a well-educated citizenry. This means ensuring that schools have the resources they need to address students’ learning needs and keep them safe.

We hope that New Jersey’s K-12 education policymakers and stakeholders find the analysis and recommendations in this series of reports useful as they prepare for the days ahead. Based on our findings, what follows is a plan for school funding during and after the current pandemic.

1.   Press for federal relief

As the authors of this series have noted elsewhere: Only the federal government has the ability to tax or borrow on the scale required to cover the states’ ongoing expenses in education, healthcare, and other sectors.[14] Earlier this year, Bruce Baker and Matthew Di Carlo presented a plan for federal intervention to stabilize revenues for public elementary and secondary schools.[15]The plan allocates revenues to states in two phases: first, a major aid package, distributed over two years, to offset the initial shock to state revenue systems; second, a gradual, three-year process of reducing federal aid back to pre-pandemic levels. This plan would help states like New Jersey avoid adopting austerity measures that would harm public schools and the students they serve. Obviously, New Jersey has limited power over federal policy. All of the state’s education stakeholders, however, should agree to work in concert to press for federal aid for schools along with the other states, which face a similar fiscal crisis.

2.   Prepare to spend more on schools to keep them safe and healthy.

The health and safety of all children must be a top priority for state and local government. Until the pandemic can be stopped, schools must prepare for a new way of teaching students. Social distancing (requiring smaller class sizes), enhanced maintenance, more health and nursing services, greater access to technology and broadband: this is the new reality of public schooling in New Jersey. The costs must be accounted for when making decisions about the allocation of state aid to schools.

3.   Maintain school funding progressiveness

In the face of the coming economic downturn, New Jersey should maintain and enhance the features of its school aid system that promote school funding progressiveness while decreasing tax regressiveness. The School Funding Reform Act (SFRA), as originally designed, drives state aid to districts serving the neediest students, which also happen to be the districts with the least ability to raise their own revenues locally. This should be the ongoing and sustained direction of SFRA: putting money where it is needed most. The state should not, therefore, change the features of SFRA that make it progressive, such as reducing student weights for low-income or English Language Learner status.

4.   Put tax increases on the table

Too often, lawmakers automatically rule out any tax increase during an economic downturn (or, for that matter, during a period of growth). But overall state and local taxes in New Jersey are regressive: the state’s wealthiest residents pay less as a percentage of their income than taxpayers in the middle quintile. Asking the most affluent residents of New Jersey to pay at least as much as the average resident so schools can function during and after a pandemic is a reasonable request and sound policy.

5.   Keep property taxes, but consider reforms

Complaints about property taxes are a perennial feature of New Jersey politics – and many of those complaints are valid. Yet despite the aforementioned problems associated with property taxes, they have the one important virtue of being much less volatile than income or sales taxes. Keeping them a part of the school funding mix, therefore, helps districts when budgeting for the future. Creative reforms to property taxation, such as such as pooling commercial and industrial property taxes and redistributing them statewide, may mitigate tax and revenue inequities and regressiveness for local residential property owners; policymakers should consider such reforms.

6.   If the state must make cuts in school aid, first target the aid going to high-capacity districts

SFRA has features that allocate state aid to school districts that already have the capacity to raise adequate funds locally. Some special education aid, for example, flows to districts that could raise needed revenues on their own. Other “categorical” aid goes to higher-wealth districts, regardless of their capacity to raise taxes. This aid is the result of political compromises; however, in a crisis, those compromises become a luxury the state cannot afford. While cutting school aid is never desirable, New Jersey should first target aid going to these “zero-aid” districts.

7.   It is better to cut school district budgets than cut school district aid

In the last recession, New Jersey, unlike other states, chose to make cuts in state aid to districts based on a percentage of their budgets, and not on a percentage of state aid they received. While the cuts were harmful, these were “better” cuts: they harmed the districts enrolling the most disadvantaged students less than they could have. If the state must cut aid, it should once again base those cuts on budgets. An even better approach would be to start by only cutting and/or reallocating state aid presently allocated to districts whose spending exceeds their formula adequacy targets.

8.   Recalibrate SFRA to new, higher learning standards

SFRA’s original spending targets were set based on old, outdated outcome goals. Schools are now expected to teach to new, more rigorous standards, while students take ambitious tests aligned to these standards. SFRA’s spending targets should be recalibrated to align with these new goals: if schools are expected to adhere to higher standards, they need more resources. It may also be valuable to consider, at this juncture, the role of health and counseling services in schools, and recalibrating state support for these purposes.

9.   Do not wait for judicial actions to equalize school funding

Judicial actions are not enough to ensure all of New Jersey’s students receive adequate funding: the state must take legislative and administrative action. Too many districts that do not have standing under the Abbott rulings have been harmed by the underfunding of SFRA. Many of these districts have large populations of Latinx, English language learners, and low-income students – the very students who need more resources to equalize educational opportunity. Education stakeholders should not expect the courts to solve this problem; the legislative and executive branches must, instead, be proactive and ensure that all of New Jersey’s children have access to well-funded schools.

10. Reconsider the increase of small, autonomous school districts

Research shows that very small schools and school districts are needlessly inefficient. In New Jersey, many are also needlessly racially segregated. Yet New Jersey has allowed the growth of these autonomous entities (some of which are charter schools) over the past decade. Some of these districts also exacerbate racial and economic segregation and isolation. In a time of economic crisis, the state should reconsider whether it can afford more small, autonomous school districts.

11. The State should conduct within-district funding equity analyses

The state should conduct analyses of within-district spending differences, not local districts. These analyses should take into account drivers of cost differences such as special education, student characteristics, grade levels, and school type (magnet, charter, etc.). The methods described in this report will provide reasonable, actionable information for schools to more equitably allocate resources.

12. School funding policies must ameliorate, not perpetuate, systemic racism

The analyses in this series of reports repeatedly show that the greatest harms from school underfunding are felt by New Jersey’s students of color, particularly Latinx and black students. For years, the state has refused to provide the necessary funding these students need to equalize educational opportunity. This must not stand. While education, by itself, cannot negate centuries of racism and oppression, it remains a necessary part of any broad program of social and racial justice. Even a severe economic downturn cannot be used an excuse to continue to underfund schools serving students of color; doing so will only continue to perpetuate the systemic racism that has oppressed these students for far too long.


Endnotes

[1] Baker, B. D. (2017). How Money Matters for Schools. Learning Policy Institute. https://learningpolicyinstitute.org/product/how-money-matters-report

[2] Jackson, C. K. (2018). Does school spending matter? The new literature on an old question (No. w25368). National Bureau of Economic Research.

[3] Shores, K., & Steinberg, M. (2017). The impact of the Great Recession on student achievement: Evidence from population data. Available at SSRN 3026151.

Jackson, C. K., Wigger, C., & Xiong, H. (2018). Do school spending cuts matter? Evidence from the Great Recession (No. w24203). National Bureau of Economic Research.

[4] Baker, B. D., & Weber, M. (2019). New Jersey’s School Funding Reform Act at 10 Years. New Jersey Policy Perspective.https://www.njpp.org/reports/in-brief-new-jerseys-school-funding-reform-act-at-10-years

[5] Which include using a competitive wage adjustment in place of a CPI to address inflation, and also to capture regional variation in wages at the labor market, rather than at the county level.

[6] The Almanac of Higher Education, 2018-19. Washington, D.C.: The Chronicle of Higher Education. https://www.chronicle.com/interactives/almanac-2018

[7] Bruce D. Baker, Mark Weber, and Drew Atchison (June 1, 2020). Weathering the storm: School funding in the COVID-19 era. Phi Delta Kappan. https://kappanonline.org/school-funding-covid-19-baker-weber-atchison/

[8] US Census Bureau Annual Survey of State and Local Government Finances, 1977-2017 (compiled by the Urban Institute via State and Local Finance Data: Exploring the Census of Governments; accessed 23-Jun-2020 02:26), https://state-local-finance-data.taxpolicycenter.org

[9] New Jersey lawmakers recently reached a deal to increase taxes on the state’s wealthiest residents. See: Tully, T. (September 17, 2020). “Deal Reached in N.J. for ‘Millionaires Tax’ to Address Fiscal Crisis” The New York Times.  https://www.nytimes.com/2020/09/17/nyregion/nj-millionaires-tax.html

[10] Rumberger, R. W., & Gándara, P. (2015). Resource Needs for Educating Linguistic Minority Students. In Handbook of Research in Education Finance and Policy (Second Ed.),  pp. 585–606. New York: Rutledge.

[11] Sugarman, J. (2016). Funding an Equitable Education for English Learners in the United States. Migration Policy Institute.  https://www.migrationpolicy.org/research/funding-equitable-education-english-learners-united-states

[12] Baker, B. D. (2016). Does Money Matter in Education? Second Edition. The Shanker Institute.http://www.shankerinstitute.org/resource/does-money-matter-second-edition

[13] See Part 3  of this series for details.

[14] Bruce D. Baker, Mark Weber, and Drew Atchison (June 1, 2020). Weathering the storm: School funding in the COVID-19 era. Phi Delta Kappan. https://kappanonline.org/school-funding-covid-19-baker-weber-atchison/

[15] Bruce D. Baker and Matthew Di Carlo (April, 2020). The Coronavirus Pandemic and K-12 Education Funding. Washington, D.C.: The Shanker Institute .https://www.shankerinstitute.org/sites/default/files/coronavirusK12final.pdf

Unprecedented and Unequal: Racial Inequities in the COVID-19 Pandemic

Published on Oct 14, 2020 in COVID-19, Health

Health disparities in the COVID-19 pandemic spotlight the long-standing inequities that permeate the health care system. Though the pandemic has been undeniably devastating throughout the country, the impact on Black and Latinx communities outpaces that on other populations.[i] Nationally, Black and Latinx residents have been three times more likely than white residents to contract COVID-19 and nearly twice as likely to die from it.[ii] These patterns are also reflected at the state level. This report examines racial disparities in New Jersey throughout the COVID-19 pandemic and suggests policy solutions to alleviate these problems and build more equitable conditions for the future.

Black and Latinx Cases, Hospitalization Rates, and Mortality Rates Outpace Others

The Garden State’s population, while increasingly diverse, still sees the impact of structural racism in its housing and occupational divides.[iii] Past redlining practices have resulted in the segregation of neighborhoods and schools, with many Black and Latinx families living in densely populated metro areas with segregated school districts.[iv] Residents of color make up over half of employees in essential, or “frontline” industries, including grocery stores and pharmacies; trucking, warehouse, and postal services; cleaning services; public transportation; health care; and child care and social services.[v] These vulnerabilities, in addition to the need for many to commute into New York City or Philadelphia for work, put these residents at greater risk for exposure to the virus. The results of that structural risk are seen in the data, with Black and Latinx populations disproportionately represented in COVID-19 case, hospitalization, and mortality rates.

Age-adjusted case, hospitalization, and mortality rates also show that New Jersey’s Black and Latinx residents have suffered directly from the disease at double to triple the rates of the state’s white and Asian residents.[vi] Due to poor socioeconomic conditions and systemic racism in the health care system, Black and Latinx communities often die at younger ages and have proportionally more young residents than white populations. This means that, amongst the elderly, there are regularly more white than Black or Latinx individuals. The elderly are the most vulnerable age group to COVID-19, which is a possible reason that the white death rate is proportionally higher than the case rate — because there are more white, as opposed to Black or Latinx, elderly residents to suffer from age vulnerability. However, Black and Latinx residents are more likely to contract, be hospitalized, and die from COVID-19 than white residents of the same age group. The age-adjusted rates, then, allow us to better compare relatively incomparable populations, by assessing what the rates would look like if the age structures (proportion in each age group) of these populations were the same. In the case of New Jersey, this shows that Black and Latinx residents have been significantly more likely to suffer from COVID-19 in every way than white or Asian residents.

The state data remains consistent with patterns seen at the national level. In the COVIDView Surveillance Summary published weekly by the Centers for Disease Control and Prevention, nationally reported hospitalization rates amongst Latinx, Black, and American Indian or Alaska Native residents are higher than those of white residents in every age group. The highest rates by age group in the national data range from 3.7 (for non-Latinx Black residents, age 65+) to 8.2 (for Latinx residents, ages 18-49 years old) times those of white residents for that age group.[vii]

Black and Latinx people are more likely to contract COVID-19 than would be expected based on their representation in most counties. Black residents have been particularly overrepresented amongst cases in Atlantic, Burlington, Camden, Essex, Gloucester, Mercer, Somerset, and Union Counties. This means that, even in places where the outbreak and surge began later and general protective measures were already put in place when the disease arrived, residents of color were still more vulnerable than others; their high numbers of deaths and cases were not just due to initial outbreak conditions. In Salem County, for example, Latinx residents made up approximately 40 percent of cases by the end of May, while only accounting for roughly 9 percent of the county population. This means that Latinx residents are between 4 and 5 times overrepresented in the county case count as compared to their representation in the population.[viii] Like with the state-level data, there is a clear divide between Latinx and Black health outcomes and white and Asian health outcomes.

Addressing racial inequities in health will take more than a quick infusion of money or testing during the public health crisis, however. Success in tackling these inequities will include not only improvements in access and quality in the health care system itself, but improvements in conditions shaped by social determinants of health that exacerbate vulnerabilities to outbreaks, such as inadequate housing,[ix] limited access to nutritious foods,[x] and low-paying jobs in unsafe environments that prove to be essential during historic pandemics.[xi]

The COVID-19 pandemic has highlighted these broader trends in socioeconomic vulnerabilities. Residents of color have seen the greatest unemployment rates throughout the crisis in New Jersey, putting them at greater risk for financial insolvency.[xii] In the Household Pulse Survey from the Census Bureau, Black and Latinx households in New Jersey were approximately three times more likely than white households to report not having enough to eat in the past seven days.[xiii] Black and Latinx residents, as well as residents identifying as multiracial, were more likely to report being behind on rental payments than white or Asian residents: Latinx residents were twice as likely as white residents to report this, while Black and multiracial residents were between 3.5 and 4 times more likely to do so.[xiv] Latinx residents were three times more likely than white residents to report lacking health insurance, in addition to being the most likely residents to experience feelings of nervousness, anxiety, and being on edge.[xv] Black residents were twice as likely as white residents to report lacking health insurance;[xvi] they were also most likely (nearly 1.5 times more likely than white residents) to report both delaying medical care and needing medical care for something other than COVID-19, but not getting it, in the past four weeks.[xvii] As a result, there are dual crises: residents of color have a greater likelihood of contracting the virus due to unhealthy conditions beyond their control, while they also face the devastating impact of the virus on long-term health and finances. This will create even greater inequities of health and well-being outcomes in the post-COVID-19 world.[xviii]

Lack of Adequate Planning and Prevention has Led to Greater Suffering

State and local lawmakers’ efforts to address racial disparities and prevent devastation that exacerbates inequities have been inadequate. New Jersey’s county leaders did not anticipate a pandemic sweeping through the state so violently; only Mercer County identified a pandemic as a hazard of concern in mitigation plans in 2018.[xix] Given this, during the early stages of the crisis, counties were less prepared, hospitals were overwhelmed, and, without known treatments and overflowing hospital beds, providers were required to ration treatments, meaning that patients were more likely to die.[xx]

This lack of preparation was not inevitable. In New Jersey, past disease outbreaks have shown that certain counties and populations are regularly vulnerable to these early stages of epidemics.[xxi] With COVID-19, the first case was identified in Bergen County, near New York City, on March 4, 2020.[xxii] The outbreak quickly spread to the neighboring counties outside of New York City, the same counties that have been vulnerable to outbreaks in the past.[xxiii] Of the state’s seven counties with majority communities of color — that is, counties with over 50 percent of the population identifying as Latinx, Asian, Black, Alaska Native, American Indian, Native Hawaiian or Other Pacific Islander, or another race outside of the white population in the 2019 American Community Survey data (Cumberland, Essex, Hudson, Mercer, Middlesex, Passaic, and Union) —  five (Essex, Hudson, Middlesex, Passaic, and Union) were among those hit the hardest by the pandemic during its early stages.[xxiv] Even within counties, communities of color suffered more than white populations, as access to resources became a determining factor in the number of cases and deaths, creating disparities between neighboring zip codes.[xxv]

This means that the harms of COVID-19 in New Jersey have been two-fold. First, the counties to initially get hit — and therefore, are most vulnerable to a surge beyond their hospitals’ capacities — were largely communities of color, resulting in many cases and deaths among residents of color. Then, in counties not hit by the early surge, Black and Latinx populations have been more vulnerable, likely due to the effects of structural racism that have created unhealthy environments and living conditions, limited access to care, and discrimination in care.[xxvi]

This lack of planning can be seen in health statistics beyond the COVID-19 data. This is because the toll of COVID-19 comes not only from cases related to the disease itself, but also from its consequences. Excess death data, which compares the deaths counted during a specific time period to average deaths during that period in previous years, can help to show a picture of the true impact of an event by accounting for not only deaths directly from COVID, but also those that may have resulted from the indirect effects of the outbreak, such as depression and other mental health challenges due to hardships or an unwillingness or fear of seeking care for other medical issues.[xxvii]

Like with the confirmed cases data, New Jersey’s most diverse communities have significant representation when examining excess deaths. Essex County, in which approximately 70 percent of residents are people of color, saw nearly 1,900 excess deaths at the peak of the pandemic in April 2020, an approximately 400 percent increase over the average April death count for the county.[xxviii] Essex County has also experienced the highest number of deaths overall from COVID-19, counting 1,901 confirmed deaths as of October 7, 2020. Additionally, there have been an estimated 229 probable COVID deaths in the county that have not been confirmed.[xxix]

While Essex County’s number of excess deaths comes close to its number of confirmed and probable COVID-19 deaths, the hundreds of additional deaths included in the data may be unconfirmed deaths due to COVID-19.[xxx] These can result from lack of access to testing, avoidance of or lack of access to care for other medical issues, or “deaths of despair” — deaths due to drugs, suicide, or alcohol — that can be connected to the stress of the COVID-19 pandemic.[xxxi] Amongst communities of color, deaths both directly from COVID-19 and deaths caused indirectly by the pandemic’s conditions are also exacerbated by “weathering,” the effect on health and well-being of living long term with inequitable socioeconomic conditions.[xxxii]

The impact of the COVID-19 pandemic does not end with hospitalizations and deaths, or even with possible unconfirmed deaths or deaths caused indirectly from the pandemic’s conditions. Differences in trust in the medical system across racial groups will cause these disparities to diverge even further. A long history of systematic racism in health care remains fresh for many Black residents, and many still experience this racism today. This has led to a distrust among Black communities, in particular, of doctors, vaccines, and other paths that will be necessary tools in containing the outbreak.[xxxiii] If people most at risk for the virus and long-term damaging effects or death are also more likely than others to either not have access to or to be unwilling to get the vaccine, then disparities will become even greater as the outbreak rages on amongst our most vulnerable populations. The more the virus continues to spread, the more that neighbors, friends, classmates, and co-workers also continue to risk contracting COVID-19, and the worse the long-term economic impact of the pandemic.

The lack of extensive data collection and transparency makes all of the efforts to address issues of inequity and build better preparedness systems more difficult. Lawmakers have been slow to initiate the collection of racial and ethnic data during both COVID-19 and previous public health emergencies, resulting in partial data and a need to try to backtrack in order to add this data to previously collected information.[xxxiv] When data is collected, the categories often used for race and ethnicity, including those used by the New Jersey Department of Health (DOH) cited here, are broad. In being so broad, they do not accurately depict the many varied experiences of residents within each race or Latinx category. They do not, for instance, differentiate between residents identifying as East Asian (such as Japanese) versus South or Southeast Asian (such as Indian). They also do not account for the different experiences of residents who are first-generation immigrants as compared to residents who identify with a racial or ethnic group but have grown up in the United States. This can be an important factor in understanding the full picture of residents’ experiences with racism in the healthcare system and therefore needs to be examined more in-depth than the data currently provides.[xxxv]

Greater Investment in the Future Health of New Jersey is Necessary

Budget choices reveal lawmakers’ values, especially when choices about access to health programs can literally be the difference between life and death. Overall, funding for DOH has significantly decreased over the past 15 years, standing 61 percent lower than its Fiscal Year (FY) 2005 levels. Funding relative to the size of the population has been reduced from $287.62 per resident in FY 2005 to $178.46 per resident in FY 2019.[xxxvi]

Some of this funding decline was due to structural changes, such as the moving of programs outside of DOH. For instance, the Division of Aging (formerly known as Senior Services) — which funds programs like the Pharmaceutical Assistance to the Aged and Disabled (PAAD) and Senior Gold programs that provide prescription drug benefits to low-income seniors and individuals with disabilities — moved to the Department of Human Services (DHS) in FY 2013.[xxxvii] In addition, the state has not increased funding for DOH to reflect increases in New Jersey’s population.

While DHS directs many services related to health (such as Medicaid) and other anti-poverty initiatives that address social determinants of health, the overall decline in direct DOH funding has resulted in diminishing support for many key divisions and programs addressing health inequities. These include the Office of Minority and Multicultural Health as well as the Communicable Disease Service, which are meant to strengthen New Jersey’s health care system and better protect New Jersey residents.

The Office of Minority and Multicultural Health, the mission of which is to “promote health equity for all and reduce health disparities,” has received the same special purpose funding ($1.5 million) from the early 2000s up until the fiscal year 2021 budget, when a slight cut was made in response to the COVID-19 crisis.[xxxviii] Because the funding was maintained at the same dollar amount, the value of those dollars has decreased over the years due to inflation.

Attention given to newer initiatives to address racial disparities, such as the Nurture NJ multi-agency campaign to address New Jersey’s abysmal Black maternal and infant mortality rates, has provided some promise of improvements in the future.[xxxix]These programs cannot be short-lived or one-off promotions, however, to truly impact the long-term health landscape for New Jersey’s populations. In order to both permanently and effectively address racial disparities in health outcomes, New Jersey lawmakers should consider prioritizing the following:

  • Build data collection capacity and transparency.
    Much of the data presented in this brief does not cover all cases, hospitalizations, or deaths. Some only cover around 50 to 60 percent of cases because racial and ethnic data was not directed to be collected until the end of April, a month after Governor Murphy instituted his stay-at-home order.[xl] The need for this data should not have been a surprise — there were many calls for better collection efforts after the 2009 H1N1 outbreak in the United States, which appear to have gone unheeded.[xli] Without data — and particularly data collected on cases, rather than just during hospitalization or post-mortem — it is impossible to determine how to most effectively and efficiently fund and design programs meant to address racial inequities.A federal initiative to regulate these types of actions across states would produce more uniform data and a clearer picture than current efforts, since states have differing practices in both the decisions to collect data and how they collect the data.[xlii] However, until federal-level initiatives are pursued, New Jersey can take its own steps to become a leader in these efforts. Regulations that automatically trigger this data collection during crises and permanent directives to collect this data would move the state forward in better understanding the consequences of outbreaks like COVID-19. Additionally, greater efforts to coordinate and support systematic population health work in the state is needed: New Jersey is currently one of only 15 states without a public health institute or participation in the National Network of Public Health Institutes.[xliii]
  • Require regular state health racial equity impact assessments for policy proposals.
    In addition to greater data transparency during crises, New Jersey should require systematic analysis of the racial impacts of policy proposals. This would both aid in providing a picture of the long-term impact a policy would have on New Jersey’s population, as well as develop a stronger understanding of policy designs that work.[xliv] Having improved data collection efforts, as mentioned in the section above, is crucial for this work.
  • Increase support for initiatives that improve trust in the medical system.
    While cultural competency training will aid in the communication between doctors and patients and therefore should be continued, it does not guarantee overall greater health outcomes unless residents of the at-risk populations come to a medical professional in the first place.[xlv] Programs that work to understand the causes of distrust and identify trusted sources of information can help to create better systems for disseminating facts about medical care and encourage take-up. Increased funding and support for New Jersey’s Office of Minority and Multicultural Health, initially established in 1991, can provide a foundation for these efforts.[xlvi]

  • Encourage policies that diversify the medical field and improve access to culturally sensitive resources.
    While steps have been made in recent years to bring more diversity to medical education and, in turn, the medical field, even more can be done to encourage the building of a medical profession that reflects the population it is serving.[xlvii]Continuing to build programs that provide support for medical professionals who come from vulnerable populations, better encourage practice in areas of greatest need, and remove barriers to providers and services to improve cultural competence of the available resources, will be necessary. New Jersey has recently taken steps in this direction by working to improve access to doula services and removing barriers to professional licenses for immigrant populations.[xlviii] The state should continue in this direction by supporting initiatives focused on greater diversity in the medical field, such as Graduate Medical Education (GME) programs, and by exploring the creation of programs that provide financial support for those serving in areas of critical need.[xlix]
  • Build racial impact results into future public health crisis preparedness plans.
    While the current New Jersey preparedness plan does provide an in-depth look into the possible severity of an outbreak, its economic costs, and environmental and structural factors that may exacerbate certain types of outbreaks, there is no discussion of the fact that certain racial and ethnic groups are more subject to those factors than others, and that the combined impact of the inequities can exacerbate the poor outcomes even further.[l]

Building on these efforts with additional policies that address housing, food insecurity, schooling, workers’ safety, and other areas that impact health will further lessen the inequities in health outcomes that we see in New Jersey. While New Jersey’s challenges in these areas seem daunting, systematic investment in programs that promote equity will lead to healthier lives for all — both during normal times and especially during future health crises.


[i] This brief refers to residents who identify as having ethnic roots in Spain or Latin America with the term “Latinx.” While this term is not used by all residents identifying with this ethnicity (see Noe-Bustamante, Luis, Lauren Mora, and Mark Hugo Lopez (2020). “About One-in-Four U.S. Hispanics Have Heard of Latinx, but Just 3% Use It.” Pew Research Center. Online: https://www.pewresearch.org/hispanic/2020/08/11/about-one-in-four-u-s-hispanics-have-heard-of-latinx-but-just-3-use-it/), this term is more inclusive of all populations with this ethnic identity, including those who may not identify as native Spanish speakers. Also, utilizing “Latinx” rather than “Latino” or “Latina” is more gender-inclusive. All of these considerations help to create more inclusivity for the population considered here, something that is particularly important in addressing structural racism in health care, which does not, in many ways, differentiate between a first-generation immigrant and later generations with these familial roots.

[ii] Oppel Jr., Richard A., Robert Gebeloff, K.K. Rebecca Lai, Will Wright, and Mitch Smith (2020). “The Fullest Look Yet at the Racial Inequity of Coronavirus.” New York Times. 5 July 2020. Online: https://www.nytimes.com/interactive/2020/07/05/us/coronavirus-latinos-african-americans-cdc-data.html

[iii] Raychaudhuri, Disha (2020). “N.J. is more diverse than ever. See how your town has changed.” NJ Advance Media for NJ.com. 19 February 2020. Online: https://www.nj.com/data/2020/02/nj-is-more-diverse-than-ever-see-how-your-town-has-changed.html

[iv] Orfield, Gary, Jongyeon Ee, and Ryan Coughlann (2017). “New Jersey’s Segregated Schools: Trends and Paths Forward.” UCLA: The Civil Rights Project. November 2017. Online: https://www.civilrightsproject.ucla.edu/research/k-12-education/integration-and-diversity/new-jerseys-segregated-schools-trends-and-paths-forward/New-Jersey-report-final-110917.pdf?_ga=2.105008256.2029930253.1598600934-536607244.1597420044; Petenko, Erin, and Disha Raychaudhuri (2018). “Why Minorities in N.J. are More Likely to be Denied Mortgages, Explained.” NJ.com. Posted 16 February 2018. Updated 30 January 2019. Online: https://www.nj.com/data/2018/02/modern-day_redlining_how_some_nj_residents_are_bei.html

[v] Center for Economic and Policy Research (2020). “A Basic Demographic Profile of Workers in Frontline Industries.” 7 April 2020. Online: https://cepr.net/a-basic-demographic-profile-of-workers-in-frontline-industries/. State-level data available in linked spreadsheet.

[vi] An important note to make about all this data from the Department of Health is that the categories for race and ethnicity are broad and, in being so broad, do not accurately depict the many varied experiences of residents within each race or Latinx category. This can be an important factor in understanding the full picture of residents’ experiences with racism in the healthcare system and therefore needs to be examined more in-depth than the data currently provides.

[vii] Centers for Disease Control and Prevention (2020). COVIDView. Weekly Summary for Week 39, ending September 26, 2020. Online: https://www.cdc.gov/coronavirus/2019-ncov/covid-data/covidview/index.html. Hospitalization rates for each age group can be found on page 10.

[viii] Salem County’s first confirmed COVID-19 case was reported on March 21, 2020, approximately 17 days after officials confirmed the first case in New Jersey. This was also the day that Governor Murphy announced the state lockdown of all non-essential businesses. See Salem County Department of Health and Human Services (2020). “Salem County Health Department Confirms First Positive Case of Coronavirus.” 21 March 2020. Online: https://health.salemcountynj.gov/salem-county-health-department-confirms-first-positive-case-of-coronavirus/; Erminio, Vinessa (2020). “Coronavirus in New Jersey: A Timeline of the Outbreak.” NJ Advance Media for NJ.com. Last updated on 12 June 2020. Online: https://www.nj.com/coronavirus/2020/03/coronavirus-in-new-jersey-a-timeline-of-the-outbreak.html

[ix] Taylor, Lauren (2018). "Housing and Health: An Overview of the Literature." Health Affairs Health Policy Brief 10. Online: https://www.healthaffairs.org/do/10.1377/hpb20180313.396577/full/

[x] Gundersen, Craig, and James P. Ziliak (2015). "Food Insecurity and Health Outcomes." Health Affairs 34 (11): 1830-1839. Online: https://www.healthaffairs.org/doi/full/10.1377/hlthaff.2015.0645

[xi] McCormack, Grace, Christopher Avery, Ariella Kahn-Lang Spitzer, and Amitabh Chandra (2020). Economic Vulnerability of Households With Essential Workers. JAMA. 2020;324(4):388–390. doi:10.1001/jama.2020.11366. Online: https://jamanetwork.com/journals/jama/fullarticle/2767630; Yearby, Ruqaiijah, and Seema Mohapatra (2020). "Law, Structural Racism, and the COVID-19 Pandemic." Journal of Law and the Biosciences (Forthcoming). No. 2020-8. Online: https://papers.ssrn.com/sol3/papers.cfm?abstract_id=3612824

[xii] Kapahi, Vineeta (2020). “Labor Day Snapshot: How New Jersey Can Honor Workers and Improve Economic Security.” New Jersey Policy Perspective. 7 September 2020. Online: https://www.njpp.org/reports/labor-day-snapshot-how-new-jersey-can-honor-workers-and-improve-economic-security

[xiii] U.S. Census Bureau (2020). Week 15 Household Pulse Survey: September 16-28. “Food Table 2b. Food Sufficiency for Households, in the Last 7 Days, by Select Characteristics: New Jersey.” https://www.census.gov/data/tables/2020/demo/hhp/hhp15.html  At the time of writing, this was the most recent release.

[xiv] U.S. Census Bureau (2020). Week 15 Household Pulse Survey: September 16-28. “Housing Table 1b. Last Month’s Payment Status for Renter-Occupied Housing Units, by Select Characteristics: New Jersey” https://www.census.gov/data/tables/2020/demo/hhp/hhp15.html At the time of writing, this was the most recent release.

[xv]  U.S. Census Bureau (2020). Week 15 Household Pulse Survey: September 16-28. “Health Table 3. Current Health Insurance Status, by Select Characteristics: New Jersey” and “Health Table 2a. Symptoms of Anxiety Experienced in the Last 7 days, by Select Characteristics: New Jersey.”https://www.census.gov/data/tables/2020/demo/hhp/hhp15.html At the time of writing, this was the most recent release.

[xvi] U.S. Census Bureau (2020). Week 15 Household Pulse Survey: September 16-28. “Health Table 3. Current Health Insurance Status, by Select Characteristics: New Jersey.” https://www.census.gov/data/tables/2020/demo/hhp/hhp15.html At the time of writing, this was the most recent release.

[xvii] U.S. Census Bureau (2020). Week 15 Household Pulse Survey: September 16-28. “Health Table 1. Coronavirus Pandemic Related Problems with Access to Medical Care, in Last 4 weeks, by Select Characteristics: New Jersey.” https://www.census.gov/data/tables/2020/demo/hhp/hhp15.html At the time of writing, this was the most recent release.

[xviii] Tolbert, Jennifer Kendal Orgera, Natalie Singer, and Anthony Damico (2020). “Communities of Color at Higher Risk for Health and Economic Challenges due to COVID-19.” Kaiser Family Foundation. 7 April 2020. Online: https://www.kff.org/coronavirus-covid-19/issue-brief/communities-of-color-at-higher-risk-for-health-and-economic-challenges-due-to-covid-19/

[xix]   New Jersey Office of Emergency Management (2018). “5.1 Identification of Hazards.” 2019 New Jersey State Hazard Mitigation Plan. Online: http://ready.nj.gov/mitigation/2019-mitigation-plan.shtml Specific chapter: http://ready.nj.gov/mitigation/pdf/2019/mit2019_section5-1_Id_Hazards.pdf. Pg. 5.

[xx] Cavallo, Joseph J., Daniel A. Donoho, and Howard P. Forman (2020). "Hospital Capacity and Operations in the Coronavirus Disease 2019 (COVID-19) Pandemic—Planning for the Nth Patient." In JAMA Health Forum 1 (3): e200345-e200345. American Medical Association. Online: https://jamanetwork.com/channels/health-forum/fullarticle/2763353; Some groups worked to build tools for building better hospital surge capacity as the pandemic developed. See, for example: Abir, Mahshid, Christopher Nelson, Edward W. Chan, Hamad Al-Ibrahim, Christina Cutter, Karishma Patel, and Andy Bogart (2020). “Critical Care Surge Response Strategies for the 2020 COVID-19 Outbreak in the United States.” Santa Monica, CA: RAND Corporation. Online: https://www.rand.org/pubs/research_reports/RRA164-1.html. See also New Jersey’s response to the surge: New Jersey Department of Health (2020). “Allocation of Critical Care Resources During a Public Health Emergency.” 11 April 2020. Online: https://nj.gov/health/legal/covid19/FinalAllocationPolicy4.11.20v2%20.pdf

[xxi] Kaulessar, Ricardo (2018). “100 years ago, Spanish flu pandemic brought dread to New Jersey.” NorthJersey.com. Online: https://www.northjersey.com/story/news/local/2018/10/09/1918-spanish-flu-pandemic-killed-thousands-new-jersey/1222214002/; Influenza Encyclopedia (n.d.) “Newark, New Jersey.” Published by University of Michigan Center for the History of Medicine and Michigan Publishing and University of Michigan Library. Online: https://www.influenzaarchive.org/cities/city-newark.html; New Jersey Office of Emergency Management (2018). “5.21 Pandemic.” 2019 New Jersey State Hazard Mitigation Plan. Online: http://ready.nj.gov/mitigation/2019-mitigation-plan.shtml Specific chapter: http://ready.nj.gov/mitigation/pdf/2019/mit2019_section5-21_Pandemics.pdf

[xxii] Office of Governor Phil Murphy (2020). “Governor Murphy, Acting Governor Oliver, and Commissioner Persichilli Announce First Presumptive Positive Case of Novel Coronavirus in New Jersey.” 4 March 2020. Online: https://www.nj.gov/governor/news/news/562020/20200304e.shtml

[xxiii] Kaulessar, Ricardo (2018). “100 years ago, Spanish flu pandemic brought dread to New Jersey.” NorthJersey.com. Online: https://www.northjersey.com/story/news/local/2018/10/09/1918-spanish-flu-pandemic-killed-thousands-new-jersey/1222214002/; Influenza Encyclopedia (n.d.) “Newark, New Jersey.” Published by University of Michigan Center for the History of Medicine and Michigan Publishing and University of Michigan Library. Online: https://www.influenzaarchive.org/cities/city-newark.html; New Jersey Office of Emergency Management (2018). “5.21 Pandemic.” 2019 New Jersey State Hazard Mitigation Plan. Online: http://ready.nj.gov/mitigation/2019-mitigation-plan.shtml Specific chapter: http://ready.nj.gov/mitigation/pdf/2019/mit2019_section5-21_Pandemics.pdf

[xxiv] NJPP Analysis of New Jersey Department of Health (DOH), Communicable Disease Service - COVID-19 Dashboard data and Census data. DOH data online at: https://covid19.nj.gov/. Estimated population data found through the American Community Survey through the Census Bureau. 2019 1-Year Estimates. Table DP05, Demographic and Housing Estimates. This can be found online at: https://data.census.gov

[xxv] Balcerzak, Ashley and Stacey Barchenger (2020). “COVID-19 in your ZIP code: Race, income can double your chance of getting sick in NJ.” NorthJersey.com. 13 July 2020. Online: https://www.northjersey.com/story/news/coronavirus/2020/07/13/coronavirus-nj-race-income-can-double-your-chance-getting-sick/5404947002/

[xxvi] Rubin-Miller, Lily Christopher Alban, Samantha Artiga, and Sean Sullivan (2020). “COVID-19 Racial Disparities in Testing, Infection, Hospitalization, and Death: Analysis of Epic Patient Data.” Kaiser Family Foundation. 16 September 2020. Online: https://www.kff.org/coronavirus-covid-19/issue-brief/covid-19-racial-disparities-testing-infection-hospitalization-death-analysis-epic-patient-data/

[xxvii] Centers for Disease Control and Prevention (2020). “Excess Deaths Associated with COVID-19.” Online: https://www.cdc.gov/nchs/nvss/vsrr/covid19/excess_deaths.htm

[xxviii] NJPP Analysis of Census Bureau data. American Community Survey, 2019 1-Year Estimates. Table DP05, Demographic and Housing Estimates. Online: https://data.census.gov

[xxix] New Jersey Department of Health, Communicable Disease Service (2020). COVID-19 Dashboard. Online: https://covid19.nj.gov/. Accessed 7 October 2020. Probable deaths are updated every week, with the latest update on 29 September 2020.

[xxx] It is important to note here that the excess deaths data only covers up until July, and so does not total deaths up until October as the COVID deaths update includes. This means that the total will likely go up for the number of excess deaths, though the later months were not the peak months of the pandemic.

[xxxi] Petterson, Steve et al (2020). “Projected Deaths of Despair During the Coronavirus Recession,” Well Being Trust. 8 May 2020. WellBeingTrust.org. Online: https://wellbeingtrust.org/areas-of-focus/policy-and-advocacy/reports/projected-deaths-of-despair-during-covid-19/

[xxxii] Forde, Allana T., Danielle M. Crookes, Shakira F. Suglia, and Ryan T. Demmer (2019). "The weathering hypothesis as an explanation for racial disparities in health: a systematic review." Annals of epidemiology 33: 1-18.

[xxxiii] Gramlich, John and Cary Funk (2020). “Black Americans Face Higher COVID-19 Risks, are More Hesitant to Trust Medical Scientists, Get Vaccinated.” Pew Research Center. 4 June 2020. Online: https://www.pewresearch.org/fact-tank/2020/06/04/black-americans-face-higher-covid-19-risks-are-more-hesitant-to-trust-medical-scientists-get-vaccinated/

[xxxiv] Kim, Soo Rin and Matthew Vann (2020). “Many States Are Reporting Race Data For Only Some COVID-19 Cases And Deaths.” FiveThirtyEight. 7 May 2020. Online: https://fivethirtyeight.com/features/many-states-are-reporting-race-data-for-only-some-covid-19-cases-and-deaths/; National Academy for State Health Policy (2020). “How States Collect Data, Report, and Act on COVID-19 Racial and Ethnic Disparities.” Online: https://www.nashp.org/how-states-report-covid-19-data-by-race-and-ethnicity/

[xxxv] Hummer, Robert A. and Iliya Gutin (2018). "Racial/ethnic and Nativity Disparities in the Health of Older US Men and Women." In Future Directions for the Demography of Aging: Proceedings of a Workshop. Washington, D.C.: The National Academies Press, Washington, DC. Pages 31-66; Enchautegui, María E. (2014). “Immigrant Youth Outcomes: Patterns by Generation and Race and Ethnicity.” Urban Institute. Online: https://www.urban.org/sites/default/files/publication/22991/413239-Immigrant-Youth-Outcomes-Patterns-by-Generation-and-Race-and-Ethnicity.PDF; Teruya, Stacey A. and Shahrzad Bazargan-Hejazi (2013). "The Immigrant and Hispanic Paradoxes: A Systematic Review of Their Predictions and Effects." Hispanic Journal of Behavioral Sciences 35 (4): 486-509.

[xxxvi] Calculated using NJPP analysis of Budget Data and Census Data from 2019 estimates (latest available). Intercensal data tables can be found at: https://www.census.gov/data/tables/time-series/demo/popest/intercensal-2000-2010-state.html. Data estimates for the 2019 population can be found at: https://www.census.gov/quickfacts/NJ. Budget information can be found at: https://www.njleg.state.nj.us/legislativepub/finance.asp

[xxxvii] This is now titled the “Division of Aging Services.”

[xxxviii] New Jersey Department of Health, Office of Minority and Multicultural Health (2020). “About Us.” Last Reviewed: 11/23/2018. Online: http://www.nj.gov/health/ommh/about-us; Budget analysis completed by author using Departmental Appropriations information on the New Jersey Office of Management and Budget (OMB) website.

[xxxix] Office of Governor Phil Murphy. “Nurture NJ.” Online: https://www.nj.gov/governor/admin/fl/nurturenj.shtml

[xl] Office of Governor Phil Murphy. “Governor Murphy Announces Actions to Require Reporting of COVID-19 Demographic Data.” 22 April 2020. Online: https://nj.gov/governor/news/news/562020/approved/20200422b.shtml

[xli] Gibbons, Ann (2020). “How can We Save Black and Brown Lives During a Pandemic? Data from Past Studies can Point the Way.” Science. 10 April 2020. Online: https://www.sciencemag.org/news/2020/04/how-can-we-save-black-and-brown-lives-during-pandemic-data-past-studies-can-point-way

[xlii] National Academy for State Health Policy (2020). “How States Collect Data, Report, and Act on COVID-19 Racial and Ethnic Disparities.” Online: https://www.nashp.org/how-states-report-covid-19-data-by-race-and-ethnicity/

[xliii] National Network of Public Health Institutes (2020). Website: https://nnphi.org/about-nnphi/. Last accessed: 9 September 2020.

[xliv] Race Forward (n.d.). Racial Equity Impact Assessment Toolkit. Online: https://www.raceforward.org/practice/tools/racial-equity-impact-assessment-toolkit; Center for the Study of Social Policy (2018). “Racial Equity Impact Assessment.” Online: https://cssp.org/wp-content/uploads/2018/08/Race-Equity-Impact-Assessment-Tool.pdf

[xlv] County Health Rankings & Roadmaps, a Robert Wood Johnson Foundation Program (2020). “Cultural Competence Training for Health Care Professionals.” Updated 27 January 2020. Online: https://www.countyhealthrankings.org/take-action-to-improve-health/what-works-for-health/strategies/cultural-competence-training-for-health-care-professionals

[xlvi] New Jersey Department of Health. Office of Minority and Multicultural Health. Online: https://www.nj.gov/health/ommh/

[xlvii] Boatright, Dowin H., Elizabeth A. Samuels, Laura Cramer, Jeremiah Cross, Mayur Desai, Darin Latimore, and Cary P. Gross (2018). "Association between the Liaison Committee on Medical Education’s Diversity Standards and Changes in Percentage of Medical Student Sex, Race, and Ethnicity." JAMA 320 (21): 2267-2269.

[xlviii] Office of Governor Phil Murphy (2020). “Governor Murphy Signs Legislative Package to Combat New Jersey’s Maternal and Infant Health Crisis.” 8 May 2019. Online: https://www.nj.gov/governor/news/news/562019/20190508a.shtml; Office of Governor Phil Murphy (2020). “Governor Murphy Signs Legislation Expanding Access to Professional and Occupational Licenses.” 1 September 2020. Online: https://www.nj.gov/governor/news/news/562020/approved/20200901c.shtml

[xlix] A good example of these efforts is the Washington Health Corps, established in 2019. See information here: https://wsac.wa.gov/washington-health-corps

[l] New Jersey Office of Emergency Management (2018). “5.21 Pandemic.” 2019 New Jersey State Hazard Mitigation Plan. Online: http://ready.nj.gov/mitigation/2019-mitigation-plan.shtml Specific chapter: http://ready.nj.gov/mitigation/pdf/2019/mit2019_section5-21_Pandemics.pdf

Labor Day Snapshot: How New Jersey Can Honor Workers and Improve Economic Security

To read a PDF version of the full report, click here.


Labor Day is a time to pay tribute to the social and economic achievements of workers and the broader labor movement. This year, essential workers are courageously keeping New Jersey’s economy and communities running despite the current health crisis. Nevertheless, these workers, among others, continue to encounter barriers to economic security and threats to their health and safety. Moreover, the challenges faced by many families as they juggle caregiving and work have become increasingly untenable. These conditions have both highlighted and deepened inequities in our workforce, as workers who are Black, immigrant, and low-income are at disproportionately high risk of exposure to the health and economic harms of COVID-19.[1]

This Labor Day, we examine the state of working New Jersey, with particular attention to the impact of COVID-19 on workers and their families. While the state government has taken several steps to improve wages, benefits, and protections for workers in recent years, including increasing the minimum wage, improving paid leave, and boosting enforcement of worker misclassification,[2] workers in New Jersey continue to face challenging conditions. This brief provides an overview of policies that would further strengthen workers’ rights and promote public health and economic security both during and beyond the current crisis.

Hourly Wage Growth Remains Slow and Uneven

While COVID-19 has created new complications for workers, income inequality was a growing problem long before the onset of the pandemic. One factor driving income inequality is the near stagnation of hourly wages for most New Jersey workers.

From World War II through the 1970s, wages and productivity grew in lockstep, building the middle class. Since the late 1970s, however, the gap between productivity and wages has steadily widened. While productivity has increased, hourly wages for most workers have remained stagnant or grown modestly. Between 1979 and 2016, productivity in New Jersey grew 80.4 percent, while median hourly compensation grew just 25.8 percent.[3]

During the same time, wages of the lowest income earners in New Jersey have remained stagnant. The wages of workers at the 10th percentile — $10.60 an hour in 2019 — have only increased 7 percent (68 cents) in total since 1979, adjusted to inflation. Recent minimum wage increases have since contributed to modest wage growth for some low wage workers, but these have yet to rectify decades of stagnation. For example, wages for the lowest paid workers decreased between 2010 and 2013, but increased when the New Jersey minimum wage increased from $7.25 to $8.25 per hour in 2014.[4] The state’s minimum wage, which has since seen additional increases, rose to $11.00 per hour at the start of 2020 and is scheduled to reach $15.00 an hour by 2024.[5] Median-wage workers in New Jersey have fared only slightly better, with a moderate hourly wage increase of 20 percent ($3.72) since 1979. In contrast, the hourly wages of high wage workers in the 90th percentile have risen much more rapidly, increasing 62 percent ($22.92) between 1979 and 2019.

Graph: Productivity Gains Far Outpace Wage Incerases in New Jersey

Racial disparities in hourly wages have not only persisted over the last four decades, but expanded, as the wages for white workers have increased more rapidly than for Black and Latinx workers. In 2019, the median hourly wage among white workers in New Jersey was $25.85, approximately 1.5 times the median wage among Black ($17.32) and Latinx workers ($17.01). The hourly median wage among Black workers has only increased 6 percent since 1979, and for Latinx workers, just 17 percent. Wages for white workers rose much faster, with a 37 percent increase in median hourly wage during the same period. In addition, while the overall gender wage gap in New Jersey has narrowed since 1979, women continue to earn lower wages than men,[6] and Black and Latinx women earn less than white women.[7]

Unprecedented Unemployment

The COVID-19 crisis has brought about unprecedented levels of job loss and unemployment insurance (UI) claims. From mid-March to mid-August 2020, 1.5 million New Jerseyans filed for UI and the state paid out $4.4 billion in benefits.[8]

Unemployment claims have reduced in recent weeks, but claim levels remain high compared to levels prior to the pandemic. The total amount of unemployment insurance benefits paid to New Jersey workers has plummeted in recent weeks following the late July expiration of the Federal Pandemic Unemployment Compensation (FPUC), which provided a $600 weekly supplement.[9]

While unemployment skyrocketed across all racial and ethnic groups, the economic harms of COVID-19 are not felt evenly among New Jersey workers. Both before and during the COVID-19 pandemic, people of color continue to experience unemployment at a higher rate than white people.[10]

The Census Bureau’s most recent Household Pulse Survey, which is based on data collected between July 16 and July 21, 2020, suggests an even harsher reality than unemployment rates.[11] According to the survey, over half (55 percent) of households in New Jersey report experiencing loss of employment income since March 13, 2020. In addition, young (ages 18-24) and Latinx New Jersey residents experienced income loss particularly high rates. 72 percent of young respondents (ages 18-24) and 71 percent of Latinx respondents reported losing employment income between March 13 and July 21. Further, 30 percent of all households reported that they expect to lose employment income in the following four weeks.

Threats to Worker Health and Safety

Workers on the frontlines of the pandemic response, including those in industries like health care, public transportation, and cleaning services, are often underpaid and lack protections. The impact of inadequate safeguards for workers is clear. In New Jersey’s long-term care facilities alone, 13,368 staff members have contracted COVID-19 and 121 have died.[12] Moreover, workers in frontline industries are more likely to earn low and moderate incomes (less than 200 percent of the poverty line) than the workforce overall.[13] The COVID-19 pandemic has intensified the already challenging circumstances that these workers must navigate.

Many essential workers also face structural barriers to economic security and rights. In New Jersey, women are much more likely to be essential workers than men. While women make up less than half (47.4 percent) of New Jersey’s workforce, 62.5 percent of workers in frontline industries are women. In addition, Black, Latinx, and immigrant workers are disproportionately represented among essential workers, making up a higher percentage of the workers in frontline industries than in the workforce overall. For example, while Black workers make up only 12.4 percent of the overall workforce, nearly 20 percent of workers in frontline industries are Black. [14]

While New Jersey has recently taken steps to strengthen the rights of workers, these protections can only be effective with proper enforcement. In New Jersey, the Division of Wage and Hour Compliance within the Department of Labor and Workforce Development is the primary agency charged with protecting workers by enforcing labor laws.[15]However, a lack of resources in this division hampers enforcement capacity and threatens workers’ rights. While the state’s workforce has increased by 8 percent since 2009, enforcement staff for worker rights protections has not kept pace. Further, workforce standards appropriations have declined by 24 percent. Overall, enforcement funding per worker has declined by 26 percent since 2009, adjusting for inflation. During a pandemic, it is especially important that the state invest adequate resources into enforcing public health and workplace safety laws.

How New Jersey Can Honor Workers and Improve Economic Security

Amid a global pandemic, it is more important than ever to support our workers and those who have lost income. Several policies and programs that would improve safety and wellbeing of workers across the state have already been proposed. Strengthening and clarifying protections and supports for workers will, by extension, will promote the wellbeing of workers’ families and the general public, improving the state’s response to the COVID-19 crisis overall.

Protect Worker Safety

Workers who face unsafe conditions have little recourse and are often met with the difficult decision of risking their income or jeopardizing their health and safety. In the absence of adequate federal mandates, it is critical that the state government provide clear guidelines and strong enforcement to ensure safety in the workplace. In circumstances where adequate safety precautions are not taken, safeguards should be in place to prevent income loss or retaliation against workers. Lawmakers are currently considering several bills that would clarify and improve worker protections during and beyond the COVID-19 pandemic.

Emergency Paid Sick Days (S2453/A4209)

Under current rules, New Jersey employers are not required to allow employees to accrue, use, or carry forward more than 40 hours of earned sick leave in a benefit year. [16] Five days of sick leave is often inadequate, particularly during a public health emergency where workers may need additional sick days to recover from an illness, isolate to prevent spread, or care for a loved one. As a result, many workers are at risk of compromising their own health, or the health of their families and coworkers, to ensure their economic security. By strengthening the ability of workers to use earned sick leave when they need it, lawmakers can better support the health and wellbeing of all New Jersey residents.

Right to Refuse Unsafe Work (A4268)

This proposal would establish a set of standards that employers must follow to ensure that worker health and safety concerns are addressed without fear of retaliation or loss of income. A4628 would also direct the New Jersey Department of Labor to develop a mechanism for identifying and addressing complaints quickly and effectively, including the establishment of a 24/7 hotline.

Good Cause/Right to First Refusal (S2454/A4153)

In most cases, workers who leave a job voluntarily are only eligible for unemployment insurance benefits if their reason for leaving is both directly related to the job and so compelling that it is clear that the worker had no choice but to quit, which is known as “good cause connected with work.”[17] S2454/A4153 would reduce barriers to unemployment insurance by clarifying that workers have the right to receive unemployment benefits under “good cause” if they leave a position conditions that jeopardize health or safety. This proposal would also strengthen worker protections by requiring employers who laid off staff during the public health emergency give those employees right of first refusal for subsequent openings for which they are qualified.

Farmworker Epidemic Health and Safety Act (S2602/A4404)

Farmworkers face unique vulnerabilities to COVID-19 given the nature of the agriculture industry. Nevertheless, the health and safety of these workers are often overlooked, putting them at risk of illness. By ensuring that employers cooperate with the recommended pandemic health and safety protections for farmworkers — including mandating COVID-19 testing, inspecting work and living spaces to ensure compliance with health and safety guidance, and creating mechanisms for informing workers and employers about their rights and responsibilities — lawmakers can better protect the workers who make New Jersey the Garden State.

Executive Order for Pandemic Protections for Essential Workers

In addition to the bills outlined above, an executive order proposed by labor and immigrants’ rights advocates would create new mechanisms for addressing violations of public health and worker safety laws. This executive order would 1) direct the New Jersey Department of Labor to establish a 24-hour “worker rights protections” hotline, 2) deputize COVID-19 safety liaisons to resolve COVID-19 disputes, 3) require essential employers to provide all essential workers with notice of their pandemic protections, 4) mandate training for essential workers and essential employers, and 5) strengthen enforcement of pandemic protection violations. This proposal would protect public health, promote safety, and boost workers’ rights.

Strengthen the Social Safety Net

As more workers face economic insecurity, it is critical that New Jersey fully fund, and remove barriers to, safety net programs, including tax credits targeted to low- and moderate- income households that help New Jerseyans pay for basic needs like food, housing, and childcare. Coupled with a strong minimum wage, strengthening tax credits for workers would better support New Jersey’s households dealing with the effects of unequal and slow wage growth, as well as support the state’s overall economy as we recover from the effects of COVID-19. In addition, ensuring that all workers have access to resources when they lose income is critical to worker wellbeing and economic security.

Earned Income Tax Credit (EITC)

The federal EITC helps low- to moderate-income families make ends meet by boosting their after-tax earnings. New Jersey has its own version of the credit, the NJ EITC, which supplements the federal benefit with a 40 percent match of the federal credit amount.[18] The EITC has been associated with improved health outcomes, educational achievements, and lifetime earning potential.[19] Recipients tend to use the credit to meet short- and medium- terms needs, such as transportation and household supplies, which increases economic activity. The EITC’s narrow eligibility requirements, however, currently exclude many New Jersey workers. The New Jersey Legislature is considering several bills that would address barriers to the state EITC. These bills would:

  • Expand eligibility to childless workers ages 18 to 24 years old (A838/S835),
  • Increase the credit amount from 40 percent to 50 percent of the federal credit over two years (in 2021 and 2022) for all recipients (A841/S836),
  • Increase the credit amount to 100 percent for all childless workers (A839/S765),
  • Enable qualifying relatives to be treated as qualifying children (A840/S764), and
  • Expand the EITC to immigrants who file taxes using an Individual Taxpayer Identification Number (A4229/S2194).

By reducing barriers to the EITC and increasing the credit amount, the program could be a stronger tool for addressing economic insecurity.

Child and Dependent Care Credit

The Child and Dependent Care Credit is a federal tax benefit that helps families cover the costs of caring for qualifying children and adult dependents.[20] In 2018, New Jersey created a state version of the Child and Dependent Care Tax Credit, which is calculated as a percentage of the taxpayer’s federal credit.[21] This credit reduces the amount of New Jersey Gross Income Tax owed; however, it does not result in a refund if no taxes are owed. By making the Child and Dependent Care Tax Credit fully refundable, families could receive a credit regardless of their tax liability, which would enable more children in families with little or no income to benefit from the program.

Address Barriers to Income Replacement and Pandemic Relief

Most New Jersey residents who have been affected by the pandemic have received some relief through federal stimulus checks, unemployment insurance, and other public programs. However, several groups of New Jerseyans have been excluded from many forms of economic relief, including undocumented immigrants and their families, people leaving incarceration, and certain people working in the cash economy. Barriers related to immigration status, for example, have excluded an estimated 686,000 state residents from the CARES Act federal pandemic stimulus checks.[22] New Jersey lawmakers are currently considering a bill that would provide a one-time payment to certain households who were excluded from federal stimulus payments and filed taxes using an Individual Taxpayer Identification Number (S2480/A4171). By providing emergency relief as well as long-term income replacement support to New Jersey residents whose earnings have been impacted by the pandemic, the state can take a step toward a more robust and even recovery from the current crisis.


End Notes

[1] Gould, Elisa and Valerie Wilson. 2020. “Black workers face two of the most lethal preexisting conditions for coronavirus—racism and economic inequality.” Economic Policy Institute. https://www.epi.org/publication/black-workers-covid/; Gelatt, Julie. 2020. “Immigrant Workers: Vital to the U.S. COVID-19 Response, Disproportionately Vulnerable.” Migration Policy Institute. https://www.migrationpolicy.org/research/immigrant-workers-us-covid-19-response

[2] New Jersey Department of Labor. January 20, 2020. “Governor Murphy Signs Sweeping Legislative Package to Combat Worker Misclassification and Exploitation” https://www.nj.gov/labor/lwdhome/press/2020/20200120_missclass.shtml

[3] Economic Policy Institute’s analysis of the Current Population Survey. 2020. “Wages by decile.”

[4] U.S. Department of Labor. “Changes in Basic Minimum Wages in Non-Farm Employment Under State Law: Selected Years 1968 to 2019.” https://www.dol.gov/agencies/whd/state/minimum-wage/history

[5] Rodriguez, Nicole. 2019. “New Jersey’s Minimum Wage Rises to $11.00.” New Jersey Policy Perspective.  https://www.njpp.org/blog/new-jerseys-minimum-wage-rises-to-11-00

[6] Economic Policy Institute’s analysis of the Current Population Survey Outgoing Rotation Group. 2020. “Wage by Gender.”

[7] American Community Survey. 2018. Table S0201: 1-Year Estimates Selected Population Profiles.

[8] https://www.nj.gov/labor/lwdhome/press/2020/20200827_paymentsupdate.shtml

[9] New Jersey Department of Labor. 2020, August 7. “Weekly Unemployment Compensation Plummets After Federal Supplement Expires.” https://www.nj.gov/labor/lwdhome/press/2020/20200827_paymentsupdate.shtml

[10] Williams, Jhacova. 2020. “State unemployment by race and ethnicity.” Economic Policy Institute. https://www.epi.org/indicators/state-unemployment-race-ethnicity/

[11] U.S. Census Bureau. 2020. Week 12 Household Pulse Survey: July 16 – July 21. “Employment Table 1. Experienced and Expected Loss of Employment Income by Select Characteristics: New Jersey.” https://www.census.gov/data/tables/2020/demo/hhp/hhp12.html

[12] New Jersey Department of Health. 2020, September 2. NJ COVID-19 Long Term Care Facilities Dashboard. https://www.nj.gov/health/cd/topics/covid2019_dashboard.shtml

[13] Rho, Hye Jin, Hayley Brown, and Shawn Fremstad. 2020. “A Basic Demographic Profile of Workers in Frontline Industries.” https://cepr.net/a-basic-demographic-profile-of-workers-in-frontline-industries/

[14] Rho, Hye Jin, Hayley Brown, and Shawn Fremstad. 2020. “A Basic Demographic Profile of Workers in Frontline Industries.” https://cepr.net/a-basic-demographic-profile-of-workers-in-frontline-industries/

[15] District attorneys, Attorney Generals, and the U.S. Department of Labor also enforce workforce protections.

[16] New Jersey Department of Labor. “NJ State Wage and Hour Laws and Regulations.” https://nj.gov/labor/wagehour/lawregs/nj_state_wage_and_hour_laws_and_regulations.html?_ga=2.266351949.21924739.1598861121-2059223368.1590513585#11D1

[17] New Jersey Department of Labor, Division of Unemployment Insurance. “What if you quit or were fired?”https://myunemployment.nj.gov/before/about/who/quitfired.shtml

[18] New Jersey Department of Treasury. “New Jersey Earned Income Tax Credit”. https://www.state.nj.us/treasury/taxation/eitc/eitcinfo.shtml

[19] Marr, Chuck, Chye-Ching Huang, Arloc Sherman, and Brandon Debot. 2015. “EITC and Child Tax Credit Promote Work, Reduce Poverty, and Support Children’s Development, Research Finds.” Center on Budget and Policy Priorities. https://www.cbpp.org/research/federal-tax/eitc-and-child-tax-credit-promote-work-reduce-poverty-and-support-childrens?fa=view&id=3793

[20] Internal Revenue Service. “Topic No. 602 Child and Dependent Care Credit.” https://www.irs.gov/taxtopics/tc602

[21] New Jersey Division of Taxation. “Child and Dependent Care Credit (P.L. 2018, c.45).” https://www.nj.gov/treasury/taxation/depcarecred.shtml

[22] Migration Policy Institute. 2020. “Mixed-Status Families Ineligible for CARES Act Federal Pandemic Stimulus Checks.” https://www.migrationpolicy.org/content/mixed-status-families-ineligible-pandemic-stimulus-checks

Does the County Line Matter? An Analysis of New Jersey’s 2020 Primary Election Results

To read a PDF version of the full report, click here.


This policy brief assesses the impact of New Jersey’s unique primary ballot design, which structures ballots around the county line, on the state’s 2020 primary election outcomes. The brief examines ten primary races – four Democratic and four Republican contests for the U.S. House of Representatives and the Democratic and Republican contests for the U.S. Senate. The results suggest that structuring ballots around the county line impacts election outcomes by steering voters towards specific candidates. The county line also increases voter confusion, contributing to overvotes and undervotes. The impact of the county line appeared to be greatest in races that did not involve an incumbent. Candidates’ share of the vote varied by as much as 50 percentage points, based on whether or not they were on the county line.

Background

New Jersey primary ballots are unlike those of any other state. Other states organize their primary ballots around the electoral position being sought, such as Senator or Governor, with candidates listed beneath or immediately to the right of each electoral position. [1] This makes it easy for voters to determine which candidates are running for each office. In contrast, nineteen of New Jersey’s twenty-one counties organize their primary ballots around a group of candidates endorsed by either the Democratic or Republican Party. These groups of county party endorsed candidates are referred to as the “county line” or the “party line,” because they are presented on the ballot as a vertical or horizontal line of names, with a candidate included for every office. The county line generally receives prime location in one of the first columns or rows on the ballot. Candidates not on the county line are placed in other columns or rows, sometimes far away from the county line candidates.

Figure 1 shows a 2020 New Jersey Democratic primary ballot from Monmouth County. The seven county line candidates are in column one. The remaining six candidates are scattered across the other four, mostly empty, columns. There is no obvious logic as to why each of the non-endorsed candidates is in a particular column. Column two includes a candidate for the U.S. Senate and two candidates for County Freeholder. Column three includes a candidate for President and his delegates. Columns four and five each include a single candidate for the U.S. House of Representatives.

Monmouth 4th District Dem Primary BallotFigure 1: Monmouth County 4th Congressional District 2020 Democratic primary ballot.

This ballot design encourages voters to pick the candidates on the county line because they are easy to find and visually distinct. The county line is further advantaged by the placement of better-known candidates, such as those running for President, U.S. Senator, or Governor, at the top of the line and the inclusion of candidates for most or all of the offices on the ballot.

Designing primary ballots in this way violates important rules of good ballot design. Most critically, spreading candidates across multiple columns or rows and placing extra columns or rows between them, makes it much harder for voters to determine which candidates are running for each office. This results in voters not realizing that some positions are contested or, conversely, disqualifying their vote by mistakenly voting for too many candidates for a given position.[2]

A recent Communications Workers of America (CWA) analysis suggests that the county line has a significant impact on voter behavior. CWA found that no state legislative incumbent on the line had lost a primary election in New Jersey between 2009 and 2018.[3] Although incumbents generally win reelection, that advantage is rarely so absolute. In New York State, for example, twenty-two state legislative incumbents lost primary elections through 2018 and additional ones lost in 2020.

The county line may provide a substantial electoral advantage in congressional elections as well. Only two congressional incumbents have lost a primary in New Jersey in the last fifty years. In both cases, they lost to other incumbents, following redistricting that eliminated one of their districts. And, in both cases, the incumbent who won the primary had also received the party endorsement and the county line in the county that decided the election.[4]

The 2020 primary provides a unique opportunity to evaluate the impact of the county line on election outcomes. Historically, most New Jersey residents have voted on election day, using voting machines. In 2020, with New Jersey an epicenter of the COVID-19 outbreak, Governor Phil Murphy issued an executive order for the primary election to be conducted by mail. Voters also could vote at a limited number of polling places on election day using provisional paper ballots, or, if the voter was disabled, on an ADA-accessible voting machine.

As a result of the Vote-By-Mail directive, voters in three counties that usually vote using a machine ballot that is organized around the county line (Hunterdon, Passaic, and Warren) instead received paper ballots that resembled those used in other states, with candidates listed beneath the position they were seeking. This increased the number of counties using such ballots to five out of twenty-one for the Democratic primary and six out of twenty-one for the Republican primary, creating an opportunity to compare how candidates performed in congressional districts that included those counties.[5]

The 2020 primary also had a large number of contested races. In a few of those races, the county party organizations endorsed and awarded the county line to different candidates. This created an additional opportunity to examine the impact of the county line on electoral outcomes.

Democratic Party Primary Results

In the Democratic primary, four congressional districts and the U.S. Senate race were contested and included some counties that did not structure their primary ballots around a county line or county parties within the congressional district endorsing different candidates.

2nd Congressional District

Amy Kennedy won all eight counties in the 2nd Congressional district. However, Kennedy received a higher percentage of the vote in the three counties where she had the county line or no one had the county line than in the five counties where her opponent Brigid Harrison had the county line (see Figure 2).

Kennedy received 75% of the vote in Atlantic County, where she had the county line, and 50% of the total vote in the five counties where Brigid Harrison had the county line, a difference of 25 percentage points. Kennedy received 67% of the vote in Ocean County, where no candidates were endorsed or awarded the county line, and 63% of the vote in Salem County, where Brigid Harrison had the county party’s endorsement, but the primary ballot is not structured around the county line.

Figure 2: 2nd Congressional District Democratic Primary. Does not include Francis and Turkavage, who received < 3% of the vote.

Figure 2: 2nd Congressional District Democratic Primary. Does not include Francis and Turkavage, who received < 3% of the vote.

This contest highlighted another aspect of how the county line may impact voter behavior. In Atlantic County, the number of valid votes cast for the U.S. Senate was substantially lower than the number cast for President (81%) or the House of Representatives (82%). In every other county, the total votes for U.S. Senate exceeded the number cast for the U.S. House of Representatives and equaled at least 97% of the total votes cast for President.

A likely explanation for Atlantic County’s unusual results is that U.S. Senator Cory Booker, whose reelection was endorsed by all twenty-one county parties, chose not to appear on the county line for the Second Congressional District’s Atlantic and Ocean County ballots. Instead, Booker bracketed with Brigid Harrison, who did not have the county line in either county (see Figures 3 and 4 for Atlantic and Ocean Democratic primary ballots for the 2nd Congressional District). Many Democratic voters, used to marking their ballots for everyone on the county line, may not have realized that the Atlantic County line did not include a candidate for U.S. Senate, or they may not have known that they could vote for candidates who are not on the county line.

2020 Atlantic County Democratic Ballot Congressional District 2Figure 3: Atlantic County 2nd Congressional District 2020 Democratic primary ballot.

Figure 4: Ocean County 2nd Congressional District 2020 Democratic primary ballot.Figure 4: Ocean County 2nd Congressional District 2020 Democratic primary ballot.

Ocean County did not experience a similar drop in votes for U.S. Senate. This may reflect the fact that Ocean County voters had to select candidates off the county line for both the U.S. Senate and House of Representatives races, making the county line less visually dominant on the Ocean County ballot and signaled to voters that voting off the line was a legitimate option. In contrast, Atlantic County voters did not have to vote off the county line for any office except the U.S. Senate.

4th Congressional District

Christine Conforti and Stephanie Schmid split endorsements in the 4th Congressional District. Conforti receiving the party endorsement in Mercer County and Schmid received the party endorsements in Monmouth and Ocean Counties. Mercer County Democratic party bylaws allow all candidates that receive at least 40% of the vote at the party’s endorsement convention to appear on the county line. This resulted in both Conforti and Schmid being included on the Mercer County line. Conforti received a larger percentage of the convention votes and the endorsement, so she was listed first (see Figure 5).

Figure 5: Mercer County 4th Congressional District 2020 Democratic primary ballot.Figure 5: Mercer County 4th Congressional District 2020 Democratic primary ballot.

Conforti won Mercer County, receiving 57% of the vote. Schmid won Monmouth and Ocean Counties, receiving 70% and 77% of the vote, respectively. Conforti received 57% of the vote when she was first on the county line and 21% of the total vote in the two counties where Schmid was on the county line, a difference of 36 percentage points. Schmid received 72% of the total vote in Monmouth and Ocean Counties, where she was the only congressional candidate on the county lines, and 32% in Mercer, where her name appeared below Conforti’s — a difference of 40 percentage points (see Figure 6).

Figure 6: 4th Congressional District Democratic Primary.

Having two candidates on the line in Mercer County also confused voters, leading to a substantial overvote. More than 32% of those who voted in the 4th Congressional District’s Democratic primary for the House of Representatives selected both Conforti and Schmid, resulting in their votes being discarded. Neither Monmouth nor Ocean Counties experienced substantial overvotes, and the number of votes cast for the House of Representatives in both counties closely mirrored those for the U.S. Senate and President. The likely explanation for the Mercer overvotes is that voters, conditioned to select everyone on the county line, marked their ballots for both Conforti and Schmid rather than voting for just one of them, as the ballot instructed them to do.

5th Congressional District

Congressperson Josh Gottheimer was endorsed by all four counties that make up the 5th Congressional District. Gottheimer received 67% of the votes in Bergen County, which structured its ballots around the county line, and 64% of the combined votes in Passaic, Sussex and Warren Counties, which did not use a county line, a difference of 3 percentage points (see Figure 7).

Figure 7: 5th Congressional District Democratic Primary.Figure 7: 5th Congressional District Democratic Primary.

9th Congressional District

Congressperson Bill Pascrell was endorsed by all three counties in the 9th Congressional District. Pascrell received 84% of the vote in Passaic County, which did not use the county line on its ballots, and 78% of the combined vote in Bergen and Hudson Counties, which used the county line (see Figure 8). Pascrell has consistently received a larger share of the vote in Passaic than in Bergen or Hudson Counties since he was first elected to represent the 9th Congressional District, following the 2010 redistricting. Pascrell’s 2020 primary performance is actually the lowest percentage of the Passaic vote that he has received in that decade.[6] It is also the only time during that decade that a majority of Passaic voters did not use a county line ballot.

Figure 8: 9th Congressional District Democratic Primary.

U.S. Senate

Senator Cory Booker was endorsed by all 21 counties in the Democratic U.S. Senate primary. He received 88% of the combined vote in the fourteen counties where he was on the line, 86% of the combined vote in the five counties that did not use a county line, and 85% of the combined vote in the two counties that had a line but Senator Booker chose not to be on it (see Figure 9). Booker’s share of the vote ranged from 85% to 91% when he was on the line and from 84% to 88% when a county did not use a line. In the two counties where Booker chose not to be on the line, he received 81% of the vote in Atlantic County and 87% in Ocean County.

Figure 9: U.S. Senate Democratic Primary.

Republican Primaries

In the Republican primary, four congressional races and the U.S. Senate race were contested and included either counties that did not structure their primary ballots around a county line or county parties within the district endorsing different candidates. Being on the county line was associated with differences of more than ten percentage points in all five races and as much as 50 percentage points in the U.S. Senate race.

2nd Congressional District

In the 2nd Congressional District, Jeff Van Drew won the endorsement and the primary in all eight counties. He received 83% of the total vote in the seven counties that used the county line on their ballots and 70% of the vote in Salem County, which did not use the county line (see Figure 10).

Figure 10: 2nd Congressional District Republican Primary.Figure 10: 2nd Congressional District Republican Primary.

3rd Congressional District

Two candidates vying for the Republican nomination in the 3rd Congressional District split the Republican party endorsements in the counties that make up that district. Kate Gibbs was endorsed and given the line by Burlington County and David Richter was endorsed and given the line by Ocean County. Gibbs received 56% of the vote when she was on the county line and 22% when she was not, for a difference of 34 percentage points.  Richter received 78% of the vote when he was on the county line and 43% when he was not, for a difference of 35 percentage points (see Figure 11).

Figure 11: 3rd Congressional District Republican Primary.Figure 11: 3rd Congressional District Republican Primary.

5th Congressional District

Four candidates competed in the 5th Congressional District, with two splitting the endorsements. John McCann was endorsed and given the county line by Bergen County. Frank Pallotta was endorsed by Passaic, Sussex and Warren Counties, none of which used the county line. McCann won Bergen County, with 45% of the vote, while Pallotta won the three remaining counties, with 62% of the total vote.

McCann received 45% of the vote when he was on the county line and 18% of the total vote when Pallotta was endorsed but there was no county line, for a difference of 27 percentage points. Pallotta received 62% of the total vote when he was endorsed but there was no county line and 41% of the vote when McCann had the county line, for a difference of 21 percentage points.

Figure 12: 5th Congressional District Republican Primary.

7th Congressional District

Three candidates competed in the 7th Congressional District race. Tom Kean Junior received the endorsement of the six counties that make up the district and won all of them. Three of those counties (Essex, Somerset and Union) structured their ballots around the county line and three (Hunterdon, Morris and Warren) did not. Kean received 86% of the total vote in Bergen, Somerset and Union, the three counties for which he had the line. He received 72% of the total vote in Hunterdon, Morris and Warren, the three two counties that did not use the line, for a difference of 14 percentage points.

Figure 13: 7th Congressional District Republican Primary.Figure 13: 7th Congressional District Republican Primary.

U.S. Senate

Five candidates competed for the Republican nomination in the U.S. Senate race, with two of them splitting the endorsements. Hirsh Singh was endorsed by four counties, all of which structured their ballots around the county line. Rikin Mehta was endorsed by seventeen counties, eleven of which structured their primary ballots around a county line.

Singh won the four counties in which he was on the line and Mehta won the eleven counties in which he was on the line. Singh received 73% of the total vote when he was on the county line and 23% when Mehta was on the county line, a difference of 50 percentage points. Mehta received 50% of the total vote when he was on the county line and 9% when Singh was on the county line, a difference of 41 percentage points.

Mehta received 35% of the total vote in the six counties that endorsed him but did not use a county line, a reduction of 15 percentage points relative to his performance on the line. Mehta also lost three of those six counties — losing Salem and Warren to Singh and Passaic to Flanagan.

Figure 14: U.S. Senate Republican Primary.Figure 14: U.S. Senate Republican Primary.

Findings

These ten primary contests differ from each other in the counties they encompass, their ballot designs, and their levels of incumbency. This variability makes it challenging to generalize from any individual contest. However, the data does point to three overarching trends:

Being on the county line appears to provide candidates with an advantage.

Candidates performed better when they were included on the county line than when they were not, in nine of the ten contests. The most substantial difference in performance was in the four contests in which different candidates were on the county line in different counties in the same congressional district (see Figure 15). In those four contests, the average vote margin between appearing on the county line and having your opponent on the county line was 35 percentage points.

The only contest in which a candidate did not perform better when on the county line was the Democratic primary in the ninth Congressional District. In that race, Congressperson Bill Pascrell received a higher percentage of the vote in Passaic County, which did not use a county line ballot, than he did in Bergen and Hudson Counties, which used county line ballots. However, the 84% of the vote that Pascrell received in Passaic County was his worst performance in that County since he began representing the ninth Congressional District in 2012. This is also the only primary during that decade for which the ballots used by the majority of Passaic’s voters were not structured around a county line.

Incumbents appear to receive a smaller advantage from the county line than non-incumbents.

These ten primaries do not allow for a comparison of how incumbents perform on the county line versus non-incumbents on a different county line, as incumbents received all the endorsements for which they were eligible. However, there were four races in which incumbents were on the county line in some counties but not in others, and two such races for non-incumbents. The advantage from being on the county line in those contests was an average of three percentage points for incumbents and fifteen percentage points for non-incumbents.

County line ballots appeared to contribute to voter confusion, resulting in substantial overvotes and undervotes.

This pattern is evident in both the Democratic CD2 primary, in which almost 20% of voters did not cast a vote for the U.S. Senate, and in the Democratic CD4 primary, in which more than 32% of the voters selected too many candidates for the House of Representatives. In both cases, the disenfranchisement of large numbers of voters is likely the result of the county line. In CD2, Cory Booker’s decision to bracket off-line may have led to voters not realizing the county line did not include a Senate candidate or not knowing that they could vote for candidates not on the county line. In CD4, the inclusion of two candidates for the House of Representatives on the county line led to almost a third of those who voted selecting both candidates and disqualifying their votes. These examples strongly suggest that New Jersey primary voters are conditioned to vote the county line and highlight how powerful the county line is in shaping voter behavior.

Figure 15: Impact of the county line.Figure 15: Impact of the county line.


End Notes

[1] Julia Sass Rubin (2020). Toeing the Line: New Jersey Primary Ballots Enable Party Insiders to Pick Winners. NJ Policy Perspectives. June. https://njppprevious.wpengine.com/reports/toeing-the-line-new-jersey-primary-ballots-enable-party-insiders-to-pick-winners

[2] Andrea Cordova McCadney, Lawrence Norden and Whitney Quesenbery (2020, February 3) Common Ballot Design Flaws and How to Fix Them, The Brennan Center. https://www.brennancenter.org/our-work/research- reports/common-ballot-design-flaws-and-how-fix-them

[3] Francisco Diez, The Likely Advantages of the Line, Communication Workers of America analysis, July 29, 2019.

[4] In 2012, incumbent Congressperson Steve Rothman was defeated by incumbent Congressperson Bill Pascrell in the 9th Congressional District primary, after Rothman’s district was eliminated following redistricting. Rothman and Pascrell split endorsements, with Rothman endorsed and on the county line in Bergen and Hudson and Pascrell endorsed and on the county line in Passaic. The turnout in Passaic substantially exceeded that of the two other counties and Pascrell received 90% of that vote, giving him the victory. In 1972, incumbent Congressperson Cornelius E. Gallagher was defeated by incumbent Congressperson Dominick Daniels, after being redistricted from the 13th to the 14thCongressional district. The district was located in Hudson County and the Hudson Democratic party endorsed Daniels in the primary.

[5] Salem and Sussex Counties do not structure their ballots around the county line for either Democratic or Republican primaries and Morris County does not structure its ballots around the county line for the Republican primaries.

[6] In 2012, Pascrell received 90% of the vote in Passaic versus 27% and 26% in Bergen and Hudson Counties, respectively, both of which endorsed his challenger. Pascrell did not have a primary challenger in 2014 or 2016. In 2018, he received 88% of the primary vote in Passaic County versus 70% in Bergen and 81% in Hudson Counties. Pascrell has been an elected official in Passaic County for forty years.

School Funding in New Jersey: Preparing Now for the 2020-21 School Year

To read a PDF version of the full report, click here.


Summary

Safely re-opening schools amidst a global pandemic is an expensive proposition. Re-opening plans require social distancing, which means smaller classes that may require staggered schedules, additional transportation, and rethinking and reorganizing the use of school spaces. School districts will also need to enhance their on-site health services, ensure safe and clean facilities, and upgrade their ability to teach remotely if it becomes necessary to do so again. Unfortunately, this crisis comes on the heels of a decade of disinvestment in New Jersey’s education system. New Jersey schools have not recovered financially since before the last recession; this is especially true for those serving the state’s low-income and Black and Latinx children. This brief illustrates the effects of the decade of disinvestment and provides recommendations for an equitable path forward. Put bluntly: safe and effective schools will cost more, not less, than in the past. The good news is that New Jersey can afford to make the required investments.

The COVID-19 Pandemic Will Drive Up Costs to Reopen Schools

As of this writing, the beginning of New Jersey’s 2020-21 school year is about one month away. Late in June, the state released its reopening plan for schools, which declares: “…absent a shift in the public health data, school buildings will open in some capacity for in-person instruction and operations in the Fall.”[1] While the state has since declared fully remote instruction will remain an options for students, there is still clearly pressure on the state and its school districts to return to some level of normalcy in K-12 education. The social and emotional well-being of children, the careers of working parents, and the future of New Jersey’s economy all depend greatly on how and when students return to school.

The state plan requires local districts to develop their own plans based on a series of “anticipated minimum standards.” What the plan does not do, however, is make any attempt to estimate the fiscal impact on districts to meet those standards, nor lay out any proposals for either districts or the state to raise additional revenues to cover these new costs. Yet stakeholders can be certain that reopening schools will require a substantial influx of resources. As the authors of this brief have noted elsewhere:

Much smaller class sizes will be required to meet social-distancing guidelines and contain the spread of the coronavirus; this, in turn, will require hiring additional personnel, finding new classroom space, and perhaps creating staggered schedules. It will mean more instructional hours for teachers, more staff hours spent cleaning and sanitizing facilities, and more complicated bus routes. Schools will have to budget for additional time and effort from maintenance and operations staff, food service workers, and other support positions. Nursing and other medical services — already inadequate in many schools (Willgerodt, Brock, & Maughan, 2018) — will need to be improved. And, to ensure equitable internet access, districts will have to redouble their investments in broadband and portable computers. Finally, since learning losses due to this spring’s school closures are likely to be most severe for students who live in poverty (Herald, 2020; Rothstein, 2020), schools in low-income neighborhoods will face especially daunting challenges come September. In short, we can expect the costs associated with reopening schools to be significantly greater this fall than in previous years, particularly in high-poverty schools and districts.[2]

In short, if New Jersey is to re-open its schools safely, it must plan to spend much more than it has in the past. This problem, however, is made worse by a difficult fact: even before the pandemic, too many of New Jersey’s school districts didn’t have the resources they needed to provide their students with an adequate education.

School Funding Never Recovered from the Last Recession

Prior to the Great Recession of 2009, New Jersey was a leader in school funding reform. Policies made in the wake of the Abbott series of rulings on school funding cases drove substantial amounts of new funding toward some of the state’s most underfunded school districts. Unfortunately, the state has since retreated in its efforts to fund schools; the percentage of New Jersey’s economy devoted to school funding has declined sharply since 2009, leaving fewer revenues available to the state’s districts.

These cuts in state effort have not been borne evenly; the school districts enrolling the highest-poverty students have suffered the greatest cuts. Years of research show that when high-poverty districts spend more money, they can help close the opportunity gap for children in those districts.[3] In 2009, the state, recognizing this reality, passed the School Funding Reform Act (SFRA), which sets minimal adequacy targets for spending, including additional funding for districts with high concentrations of economically disadvantaged students. But the state has never fully funded the law; consequently, more and more students are enrolled in districts that, by the state’s own standards, are underfunded. Last year, over 100,000 students attended schools in districts where this spending gap was greater than $5,000 per pupil. (For context: average budgeted cost per pupil in 2018-19 was $16,599.)[4]

Analysis of these districts reveals a disturbing trend: many are districts enrolling large proportions of students of color, particularly Latinx students. Neither the pandemic nor the ensuing economic collapse should be used as an excuse to allow these districts to continue operating without the funding the state’s own law says they need.

Ensure the Wealthiest Taxpayers Pay Their Fair Share to Help Fund New Jersey’s Schools

Ideally, New Jersey (and all other states) should be receiving a sizeable school aid package from the federal government, which has advantages over states in being able to raise large amounts of tax revenues and/or borrow large sums at historically low rates. But New Jersey’s education policymakers have to be realistic; given the current political climate and federal administration, it is quite possible that federal aid will not be forthcoming in the next several months.

New Jersey, therefore, must raise additional revenues on its own. It is worth noting that while complaints about high taxes are a regular feature of the state’s political debates, New Jersey is not a high-tax outlier: it ranks 31st in the nation on own-source revenues (the revenues the state raises itself, rather than those transferred by another government), and eighth in the nation on state and local taxes as a percentage of income.[5] For school funding, there are two approaches to raising taxes that the state can use concurrently. First, New Jersey should raise income tax rates on its wealthiest residents. New Jersey’s taxes are less regressive than many of its neighbors, but its wealthiest residents still pay effective rates lower than those of middle-class taxpayers.

Second, New Jersey can suspend sending state aid to its most affluent school districts – the districts that have greater property wealth and, therefore, are more able to raise revenues themselves through local property taxes. Some state aid for special education, for example, automatically goes to more affluent districts, regardless of those districts’ ability to raise local revenues for schools. Certainly, spending on special education should not be cut in any district without good reason; however, if fiscal realities require cutting state aid, New Jersey should target the aid flowing to these high-capacity districts, and allow those districts to raise local taxes if needed to replace that aid. This policy should also extend to other types of categorical aid that are allocated outside of the adequacy formula, including transportation, security, and school choice aid.

School Funding After the Pandemic

In the coming months, the authors of this brief will further explain how New Jersey should change its current school funding system to better meet the needs of its students during and after the current health crisis. Reforms should include: recalibrating the state’s funding formula to meet new standards; using valid methods to address within-district funding inequities; basing state aid cuts on district budgets, and not aid allocations, and; maintaining and enhancing the features of SFRA that promote funding progressiveness. Until then, New Jersey lawmakers must act immediately to provide districts with the funding they need to open safely this fall.


End Notes

[1] The Road Back: Restart and Recovery Plan for Education. New Jersey Department of Education. https://nj.gov/education/reopening/

[2] https://kappanonline.org/school-funding-covid-19-baker-weber-atchison/

[3] Baker, B. D. (2017). How Money Matters for Schools. Learning Policy Institute. https://learningpolicyinstitute.org/product/how-money-matters-report

[4] https://www.nj.gov/cgi-bin/education/csg/19/csggrsum.pl?string=L.%20ALL&maxhits=10000

[5] Annual Survey of State and Local Government Finances, 1977-2017. Compiled by the Urban-Brookings Tax Policy Center. Washington, DC: Urban-Brookings Tax Policy Centers (2017). Date of Access: (11-Dec-2020).

Building a More Immigrant Inclusive Tax Code: Expanding the EITC to ITIN Filers

To read a PDF version of the full report, click here.


The Earned Income Tax Credit (EITC) is a proven tool for addressing racial disparities in pay and supporting the economic security of low- and moderate-income adults and their families.[1] Claimed when people file income tax returns, this refundable credit increases households’ after-tax income. New Jersey, along with 28 other states,[2] offers a state version of the EITC. The New Jersey EITC supplements the federal program and is calculated as a percentage of the federal EITC.[3] By boosting the wages of low paid workers, the state and federal EITC programs help New Jerseyans better afford their basic needs, improve health and educational outcomes,[4] and strengthen state and local economies.[5]

The EITC’s narrow eligibility requirements exclude certain groups, including immigrants who file taxes without a Social Security Number.[6] As a result, many immigrants are ineligible for this important program, even if they pay taxes using an Individual Taxpayer Identification Number (ITIN). Extending eligibility for the state’s EITC to include ITIN holders would make the program more inclusive and increase its impact, allowing the credit’s benefits to reach more New Jersey families and communities. This simple change to the program’s eligibility would help more New Jerseyans make ends meet and infuse more money into the economy as the state recovers from the ongoing COVID-19 pandemic.

The Tax Code Can Better Address Racism and Anti-Immigrant Bias

A history of systemic racism in the United States has shaped policymaking and access to economic opportunity, resulting in massive inequities in the distribution of wealth.[7] Consequently, tax policy has disparate impacts across racial lines. The tax code can be a tool for addressing these disparities; however, many tax provisions instead reinforce or exacerbate inequities.[8]Income derived from work, for example, is taxed at a higher rate than income derived from capital gains, which disproportionately benefits wealthy households.[9] The EITC functions in the opposite manner, benefiting low- and moderate-income tax filers, who are disproportionately people of color.

While racial inequity has always been embedded in the U.S. tax code and immigration system, the Trump administration’s policies are exacerbating economic exclusion. The Tax Cut and Jobs Act of 2017, for example, made changes that widen racial and wealth disparities by giving disproportionate tax breaks to high wealth households,[10] including corporate, individual income, and estate tax rate reductions, as well as a new tax break for pass-through business income.[11] The law failed to provide comparable improvements for low- and moderate-income households and created new barriers for immigrants who do not have a Social Security Number (SSN). For example, the law reduced the Child Tax Credit,[12] which helps working families with children under 17 offset the cost of raising children, for families who file taxes with an ITIN.

To rectify these racial inequities in the tax code, lawmakers could choose to raise revenue in a progressive manner and make strategic investments that support households with the greatest need. New Jersey lawmakers could also improve equity in the state tax code by eliminating or reducing tax expenditures (exclusions, deductions, deferrals, and credits) that benefit wealthy households.[13] Strengthening programs that benefit low- and moderate-income households, such as New Jersey’s EITC, is another step that lawmakers can take to reduce racial and wealth disparities in the state tax code.

Federal EITC Eligibility Requirements Exclude ITIN Filers

In order to qualify for the federal EITC, a taxpayer, their spouse, and any qualifying children claimed as dependents must have a Social Security Number (SSN).[14] This undermines the reach of the EITC in New Jersey, as an estimated 225,000 residents live in households that file taxes using an ITIN,[15]which is a tax processing number used by tax filers who are not eligible for a SSN.[16] Tax filers who use an ITIN include undocumented immigrants, as well as a small number of other immigrants, such as certain students, professors, and researchers with non-immigrant visas; spouses and family members of people with certain employment visas; and some survivors of trafficking, domestic violence, or other serious crimes.[17][18] These immigrants not only pay income taxes, but they also pay sales taxes at the counter like all other New Jersey residents. In addition, ITIN filers pay property taxes, either directly as property owners or by supporting their landlord’s payments of property taxes as renters. In fact, undocumented immigrants in New Jersey contribute nearly $600 million in state and local taxes each year.[19]

Despite their important contributions as workers, business owners, taxpayers, and community members, ITIN holders are systematically excluded from many of the programs available to other New Jersey residents. In addition to the federal EITC, ITIN filers and their families have been excluded from many public benefits as well as stimulus payments under the Coronavirus Aid, Relief, and Economic Security (CARES) Act.[20]

Like most states, New Jersey’s EITC adopts the same eligibility criteria as the federal EITC, and thus excludes ITIN filers.[21] Legislation to address this barrier to the state EITC has been introduced in both the New Jersey Senate and General Assembly.[22] This policy would follow the lead of several other states that have taken steps to eliminate the discriminatory eligibility requirements in the EITC. Expansion of the EITC to include ITIN filers has already been enacted in California (for parents with at least one child under six years old) and in Colorado.[23] Similar eligibility expansions have also been proposed in New Mexico,[24] Oregon,[25] and Washington.[26] New Jersey can join these states in addressing an important barrier to the federal EITC by extending the state version of the credit to include ITIN filers.

Extending EITC Eligibility is a Step Toward a More Inclusive Tax Code

Because undocumented immigrants are disproportionately people of color,[27] removing the SSN requirement of the New Jersey EITC would improve racial equity in the tax code and promote the economic security and well-being of thousands of New Jersey’s immigrant households. Rather than further straining low- and moderate-income immigrants and their families, New Jersey can harness the existing ITIN and EITC systems to help those who need it.

An estimated 77,650 ITIN returns filed in New Jersey meet all eligibility criteria for the EITC except for the SSN requirement. Assuming that participation rates are comparable to the EITC for New Jersey residents, eliminating the SSN requirement would result in an estimated 54,100 of these newly eligible ITIN holders receiving the EITC.[28]  

Chart: Expanding the EITC to ITIN filers would boost the wages of thousands of families and stimulate New Jersey's economy

Expanding the EITC program eligibility to include ITIN filers would add, on average, approximately $1,000 to these households’ earnings.[30] Beyond support for hardworking New Jerseyans and their families, making the state EITC more inclusive toward immigrants would provide a $55 million[31] boost to state and local economies, as newly eligible EITC claimants spend the credit at local business and increase economic activity. Some of these funds will even come back to the state in the form of sales tax and other government revenues[32].

In the absence of a federal EITC for ITIN filers, lawmakers should consider providing a credit comparable to what other low wage New Jerseyans receive. Going beyond the state EITC, if New Jersey matched the EITC amount that ITIN filers would receive if they were eligible for the federal credit, the state could add $151 million to state and local economies and allow families to cover more of their basic needs.[33] Providing ITIN filers with both the full federal and state credit amount that other New Jersey workers receive would provide more meaningful support for these households and add $206 million to state and local economies.[34]

Strengthening New Jersey Families and Economies

Excluding immigrants who file taxes using an ITIN from the EITC pushes households who are struggling to make ends meet further behind and hurts New Jersey’s state and local economies. There are approximately 140,000 households in New Jersey who file taxes using an ITIN, with over 225,000 people in these households, of which 85,560 (38 percent) are children.[35] Boosting the after-tax incomes of these low- and moderate- income households would have both short- and long-term benefits for the children in families and communities that receive the credit, as the EITC has been associated with improved health outcomes, educational achievements, and lifetime earning potential.[36]

As recipients of the EITC use the credit to meet short- and medium- term needs, such as utility bills, household supplies, and vehicle repairs, removing discriminatory barriers to the credit would increase economic activity and support businesses as they recover from the current crisis. Including ITIN holders in the EITC would not only promote equity by directly supporting households who need it – it would also strengthen the broader New Jersey economy.


End Notes

[1] Huang Chye-Ching and Roderick Taylor. 2019. “How the Federal Tax Code Can Better Advance Racial Equity.” Center on Budget and Policy Priorities. https://www.cbpp.org/research/federal-tax/how-the-federal-tax-code-can-better-advance-racial-equity

[2] Urban Institute. 2020. “State Earned Income Tax Credits” https://www.urban.org/policy-centers/cross-center-initiatives/state-and-local-finance-initiative/state-and-local-backgrounders/state-earned-income-tax-credits  

[3] New Jersey Department of the Treasury. New Jersey Earned Income Tax Credit.  https://www.state.nj.us/treasury/taxation/eitc/eitcinfo.shtml

[4] Marr, Chuck, Chye-Ching Huang, Arloc Sherman, and Brandon Debot. 2015. EITC and Child Tax Credit Promote Work, Reduce Poverty, and Support Children’s Development, Research Finds. Center on Budget and Policy Priorities. https://www.cbpp.org/research/federal-tax/eitc-and-child-tax-credit-promote-work-reduce-poverty-and-support-childrens?fa=view&id=3793

[5] Avalos, Antonio and Sean Alley. 2010. The economic impact of the Earned Income Tax Credit (EITC) in California. California Journal of Politics and Policy, 2(1): 1-25. https://doi.org/10.2202/1944-4370.1096

[6]  Internal Revenue Service. Earned Income Tax Credit (EITC). https://www.irs.gov/credits-deductions/individuals/earned-income-tax-credit

[7] Huang Chye-Ching and Roderick Taylor. 2019. “How the Federal Tax Code Can Better Advance Racial Equity.” Center on Budget and Policy Priorities. https://www.cbpp.org/research/federal-tax/how-the-federal-tax-code-can-better-advance-racial-equity

[8] Tax Policy Center and the Urban Institute. 2020.. Racial Disparities and the Income Tax System. https://apps.urban.org/features/race-and-taxes/

[9]  Huang Chye-Ching and Roderick Taylor. 2019. “How the Federal Tax Code Can Better Advance Racial Equity.” Center on Budget and Policy Priorities. https://www.cbpp.org/research/federal-tax/how-the-federal-tax-code-can-better-advance-racial-equity

[10] Institute for Taxation and Economic Policy. “TCJA By the Numbers, 2020”  https://itep.org/tcja-2020/

[11] Huang Chye-Ching and Roderick Taylor. 2019. “How the Federal Tax Code Can Better Advance Racial Equity.” Center on Budget and Policy Priorities. https://www.cbpp.org/research/federal-tax/how-the-federal-tax-code-can-better-advance-racial-equity

[12] Ibid.

[13] Further information about these strategies for improving tax equity can be found in the following reports:

Reynertson, Sheila. 2020. “Road to Recovery: Reforming New Jersey’s Income Tax Code”. New Jersey Policy Perspective. https://www.njpp.org/budget/road-to-recovery-reforming-new-jerseys-income-tax-code

Reynertson, Sheila. 2020. “The COVID-19 Crisis Proves the Point: New Jersey Needs More Revenue to Support Workers, Families, and Businesses.” New Jersey Policy Perspective. https://www.njpp.org/budget/the-covid-19-crisis-proves-the-point-new-jersey-needs-more-revenue-to-support-workers-families-and-businesses

[14] Internal Revenue Service. “Do I Qualify for the EITC?” https://www.irs.gov/credits-deductions/individuals/earned-income-tax-credit/do-i-qualify-for-earned-income-tax-credit-eitc

[15] Institute for Taxation and Economic Policy. 2020. “Estimated Number of Adults & Children in ITIN Households based on IRS 2015 ITIN Market Segment SPEC Returns Database.” This analysis is unpublished, but can be made available upon request.

[16] Internal Revenue Service. “Individual Taxpayer Identification Number.” https://www.irs.gov/individuals/individual-taxpayer-identification-number

[17] National Immigration Law Center. “Individual Taxpayer Identification Number (ITIN).” Last Updated January 2017. https://www.nilc.org/issues/taxes/itinfaq/

[18] Internal Revenue Service. Taxpayer Identification Number.  https://www.irs.gov/individuals/individual-taxpayer-identification-number

[19] Nava, Erika. 2018. “Undocumented Immigrants Pay Taxes: County Breakdown of Taxes Paid.” New Jersey Policy Perspective. https://www.njpp.org/blog/undocumented-immigrants-pay-taxes-county-breakdown-on-taxes-paid-in-2017

[20] Migration Policy Institute. 2020. “Mixed-Status Families Ineligible for CARES Act Federal Pandemic Stimulus Checks.” https://www.migrationpolicy.org/content/mixed-status-families-ineligible-pandemic-stimulus-checks.

[21] New Jersey Department of Treasury. “New Jersey Earned Income Tax Credit”. https://www.state.nj.us/treasury/taxation/eitc/eitcinfo.shtml

[22] New Jersey General Assembly. 2020. A4229. https://www.njleg.state.nj.us/2020/Bills/A4500/4229_I1.PDF

[23] Colorado General Assembly. 2020 Regular Session. HB20-1420. http://leg.colorado.gov/bills/hb20-1420

[24] New Mexico Legislature. 2020 Regular Session. HB 148. https://www.nmlegis.gov/Legislation/Legislation?Chamber=H&LegType=B&LegNo=148&year=20

[25] Oregon Legislative Assembly. House Bill 3028. https://s3.amazonaws.com/fn-document-service/file-by-sha384/7d2d89b1041b2e92228fee94ab8734aa2ac87fa89161ac7506b58be4377797166ba273f7ea0c6d70a8190388022bb0c2

[26] Washington House Committee on Finance. House Bill 2521. http://lawfilesext.leg.wa.gov/biennium/2019-20/Pdf/Bill%20Reports/House/2521%20HBR%20FIN%2020.pdf?q=20200216012900

[27] Center for Migration Studies. “State-Level Unauthorized Population and Eligible-to-Naturalize Estimates” http://data.cmsny.org/

[28] Gee, Lisa. (2020). “Impact of Including Eligible ITIN Filers in the Federal and State Earned Income Tax Credits.” Institute on Taxation and Economic Policy.

[29] Estimates of EITC eligible returns adjusted based on participation rates for the federal EITC, with a further 10% reduction to account for attrition between the state and federal EITC. The total number of ITIN tax returns that would be EITC eligible but for the SSN requirement is estimated to be 77,560.

[30] The EITC amount that households are eligible is calculated based on income and family size. The maximum NJ state credit amount for households without children is $206. The maximum NJ EITC amount for households with children ranges from $1,375 for families with one qualifying children, to $2557 for families with three or more qualifying children. More details about NJ EITC credit limits can be found here: https://www.state.nj.us/humanservices/dfd/programs/eitc/

[31] Institute for Taxation and Economic Policy. (2020). Estimated Number of Adults & Children in ITIN Households based on IRS 2015 ITIN Market Segment SPEC Returns Database.

[32] Avalos, A., and Alley, S. (2010). The economic impact of the Earned Income Tax Credit (EITC) in California. California Journal of Politics and Policy, 2(1): 1-25. https://doi.org/10.2202/1944-4370.1096

[33] Gee, Lisa. (2020). “Impact of Including Eligible ITIN Filers in the Federal and State Earned Income Tax Credits.” Institute on Taxation and Economic Policy.

[34] Ibid.

[35] Institute for Taxation and Economic Policy. 2020. Estimated Number of Adults & Children in ITIN Households based on IRS 2015 ITIN Market Segment SPEC Returns Database.                                          

[36] Marr, Chuck, Chye-Ching Huang, Arloc Sherman, and Brandon Debot. 2015. EITC and Child Tax Credit Promote Work, Reduce Poverty, and Support Children’s Development, Research Finds. Center on Budget and Policy Priorities. https://www.cbpp.org/research/federal-tax/eitc-and-child-tax-credit-promote-work-reduce-poverty-and-support-childrens?fa=view&id=3793

Toeing the Line: New Jersey Primary Ballots Enable Party Insiders to Pick Winners

To read a PDF version of the full report, click here.


The infamous Florida butterfly ballot of 2000, which may have cost Al Gore the Presidency, highlights the dramatic consequences of bad ballot design for general election outcomes.[1] The design of primary election ballots can also have substantial consequences, as these elections determine which candidates advance to the general election. This research brief demonstrates how a unique ballot design has been helping shape electoral outcomes in New Jersey for more than two decades, shifting the power to decide who wins primary elections away from the voters and towards a small group of party insiders who control the candidate endorsement process.

New Jersey Primary Ballots

A review of primary ballots in all fifty states and the District of Columbia finds that New Jersey’s ballots look very different from those in other states.[2] In all other states and DC, primary ballots are organized by the electoral position being sought, with candidates listed beneath each position (see Figure 1, Elko County, Nevada ballot) or immediately to the right of each position (see Figure 1, Sussex County, Delaware ballot). These ballot designs make it easy for voters to identify which candidates are running for which electoral office.

Figure 1: Elko County, NV 2018 Democratic Primary Ballot (left) and Sussex County, DE 2018 Democratic Primary Ballot (right).

By contrast, in nineteen of New Jersey’s twenty-one counties, the machine primary ballots used by the majority of voters are organized around a slate of candidates endorsed by either the Democratic or the Republican Party.[3] These slates of candidates are known as the “county line” or the “party line,” in reference to the fact that the endorsements are determined at the county party level and the endorsed candidates are presented on the ballot as a vertical or horizontal line of names. Candidates not on the line are placed in other columns or rows, sometimes far away from the county line candidates.

Figure 2 shows the 2018 New Jersey Democratic primary ballot from Camden County. The nine county line candidates are in column 2. The remaining fifteen candidates are scattered across the other eight, mostly empty, columns. There is no obvious logic as to why each of the non-endorsed candidates is in a particular column. Column 1 includes a single candidate for the U.S. Senate. Columns 3 through 8 include eleven candidates for Camden County Freeholder. Column 9 includes two candidates for the US House of Representatives and a candidate for the Camden City Council.

A screenshot of a social media post

Description automatically generated
Figure 2: Camden County, NJ 2018 Democratic Primary Ballot.

This ballot design — particularly listing candidates for the same office in different columns that may not even be adjacent, and candidates for different offices in the same column — makes it much more challenging for voters to determine which candidates are running for each office. Such a ballot design results in voters not realizing that some positions are contested or disqualifying their vote by mistakenly voting for too many candidates for a given position.[4] It also encourages voters to pick the candidates on the county line — an easy to find and visually consistent option. The county line is further advantaged by the placement of better-known candidates, such as those running for President, U.S. Senator, or Governor, at the top of the line and the inclusion of candidates for most or all of the offices on the ballot.[5] It is very challenging for candidates not endorsed by the party to compete with the county line by assembling a full slate of candidates that includes someone running for every position.

The county line is particularly advantageous for candidates whose names may be less familiar to voters, such as those running for the state legislature, and county-level or local positions. But the county line seems to provide a substantial electoral advantage regardless of the office being sought. A recent analysis by the Communications Workers of America found that no state legislative incumbent on the line had lost a primary election in New Jersey between 2009 and 2018.[6] Although incumbents generally win reelection, that advantage is rarely so absolute. In New York State, for example, twenty-two state legislative incumbents lost primary elections over the same time period.[7]  

The line provides an advantage for non-incumbents as well. For example, in the 2017 Democratic primary for Governor, Phil Murphy was endorsed by all 21 county political parties. Murphy won the primary in 20 of those counties but lost Salem county to John Wisniewski. Wisniewski’s win of Salem County is the first time since 1997 that a candidate in a Democratic primary for Governor or U.S. Senator won any county without being part of the county line.[8] Salem is also one of only two New Jersey counties, along with Sussex, that do not organize their Democratic and Republican machine primary ballots around a county line. Instead, the County Clerks in those two counties structure their primary ballots around the electoral positions being sought, like ballots in every other state in the country.[9]

The difference between the Salem and Sussex primary ballots and those in the rest of the state is dramatic. Figure 3 shows the gubernatorial portions of New Jersey’s 2017 Democratic primary ballots for Salem and Sussex counties versus the Middlesex County ballot. The six candidates for Governor are clearly identified as such in the Salem and Sussex ballots. In contrast, the Middlesex ballot lists the names of the six gubernatorial candidates over five different columns, with one of the candidates – Wisniewski – in a separate row from the other five. It is not surprising that candidates without party endorsement have little chance of winning when their names are presented to voters in such a confusing manner. 

A screenshot of a cell phone

Description automatically generated
Figure 3: Salem County, NJ 2017 Democratic Primary Ballot (top left); Sussex County, NJ 2017 Democratic Party Ballot (top right); Middlesex County, NJ 2017 Democratic Primary Ballot (bottom).

Fair Primary Ballots for New Jersey

Problematic ballot design is frequently unintentional, the result of “overworked local officials who don’t have the time or staff to test whether a design works.”[10] When it comes to New Jersey primary ballots, however, faulty design is a feature rather than a bug. As detailed by Brett Pugach in a forthcoming Rutgers Law Review article, New Jersey’s primary ballot design reflects a combination of state laws and decades of court rulings that have created a confusing patchwork of regulations. The state’s county party organizations seem to have taken advantage[11] of this confusion to control the design of primary ballots, as a powerful means of benefitting the election of their chosen candidates.[12]

The New Jersey legislature could ensure that the state’s voters and not party insiders determine who wins primary elections by passing legislation that requires New Jersey primary ballots to be structured like those in other states. Those ballots would clearly indicate the title of each office being sought and, underneath or to the side of that, list the names of each candidate running for that office. To maximize ballot fairness, the candidates’ names would be randomly drawn and the order rotated by district, to counter the advantages of first-ballot position. Legislation that requires ballots organized in this manner ought to be a top reform priority for any legislators who care about election fairness.


End Notes

[1] Spenser Mestel (2018). How bad ballot design can sway the result of an election, The Guardian, November 19.

[2] The review included 2010 to 2020 primary ballots from at least four counties in every state and from the District of Columbia, as well as 2017 to 2020 primary ballots from all 21 New Jersey counties. See https://drive.google.com/drive/folders/1vudVsxEcLvY2nZAfD_k88780nyh5sGCr?usp=sharing

[3] Some counties that use a county line for in-person machine voting ballots have used Vote-by-Mail paper ballots that are structured like ballots in other states, by the electoral positions being sought. In 2020, Hunterdon, Passaic, Salem, Sussex and Warren Counties are all using such Vote-by-Mail ballots for the Democratic and Republican primaries and Morris County is using such a ballot for the Republican primary. Historically, few New Jersey residents have voted by mail, so the impact of these ballots has been minimal. In 2020, however, the entire state is voting by mail, creating a natural experiment to assess the effect of the county line on voter behavior.

[4] Andrea Cordova McCadney, Lawrence Norden and Whitney Quesenbery (2020, February 3) Common Ballot Design Flaws and How to Fix Them, The Brennan Center. https://www.brennancenter.org/our-work/research-reports/common-ballot-design-flaws-and-how-fix-them

[5] In years when there are no statewide or national contests, the candidates for State Senate or Assembly are placed at the top of the county line.

[6] Francisco Diez, The Likely Advantages of the Line, Communication Workers of America analysis, July 29, 2019.

[7] Diez

[8] Nick Acocella, 2017. How Much Does the Line Matter? InsiderNJ.com, June 10. https://www.insidernj.com/much-line-matter/

[9] Morris County does not organize its Republican primary ballot around the county line. However, the Democratic primary ballot in Morris County is organized around the county line.

[10] Danielle Kunits (2020, June 12) Don’t Let Mail-in Voting be thwarted by badly designed ballots. The Washington Post. https://www.washingtonpost.com/opinions/2020/06/12/these-are-9-senate-seats-most-likely-flip/?

[11] Julia Sass Rubin (2020, June 26). Can Progressives Change New Jersey? The American Prospect. https://prospect.org/politics/can-progressives-change-new-jersey/

[12] Brett Pugach (forthcoming). The County Line: The Law and Politics of Ballot Positioning in New Jersey. Rutgers University Law Review.