On August 12, the Census Bureau released detailed data tables to assist states in drawing new congressional and legislative district lines. This first look at detailed population counts provides basic race and ethnicity data that should be carefully considered when redrawing district boundaries so as not to dilute the voting power of racial and ethnic groups. As it stands, New Jersey’s state legislature is disproportionately white, with low representation from Asian and Latinx/Hispanic communities. New Jersey’s new districts should ensure that these groups end up with a proportional and fair voice when allocating political power.
Statewide Changes
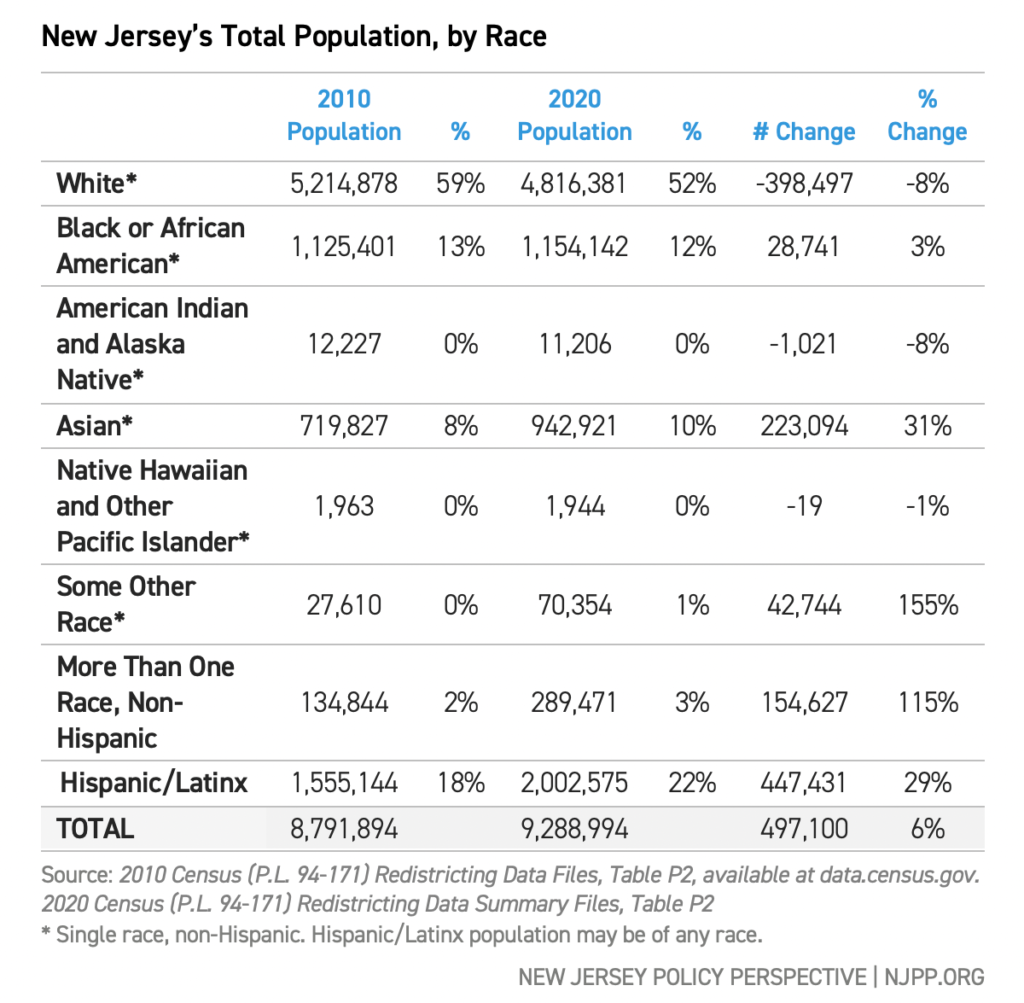
Overall, the Garden State has gained almost half a million residents since 2010, growing at a 5.7 percent rate, debunking the oft-repeated myth that New Jersey is losing population. New Jersey is also growing more racially and ethnically diverse, especially its child population.
Latinx/Hispanic and Asian populations heavily drove New Jersey’s growth in the 2010s. Latinx/Hispanic populations grew by 447,000, or 29 percent, while Asian/Asian-American populations grew by 223,000, or 31 percent. The Black/African-American population saw a more modest increase, growing by about 29,000, a 3 percent increase from 2010. White non-Hispanic populations declined by about 399,000, an 8 percent decline from 2010.
Census figures show that the state is growing more diverse, but the limited racial and ethnic categories in the current data release fall short of capturing the full array of New Jersey’s communities and ethnic groups. Headlines highlighting the decline in “white” population are often focused on the non-Hispanic white population. But the Census counts Hispanic/Latinx status as a separate ethnicity from race, meaning that a person can mark that they are Hispanic/Latinx and that they are white, Black, Asian, or any other race. Subsequent Census data releases will include a breakdown of the racial identification of Hispanic/Latinx respondents.
Complicating racial and ethnic breakdowns further, one notable area of growth is people selecting “some other race” or “more than one race,” suggesting the limitations of existing racial categories on the Census questionnaire. People selecting “some other race” increased by 155 percent, while non-Hispanic people selecting “more than one race” increased by 115 percent. These trends are even more pronounced in the child population.
 Child Population
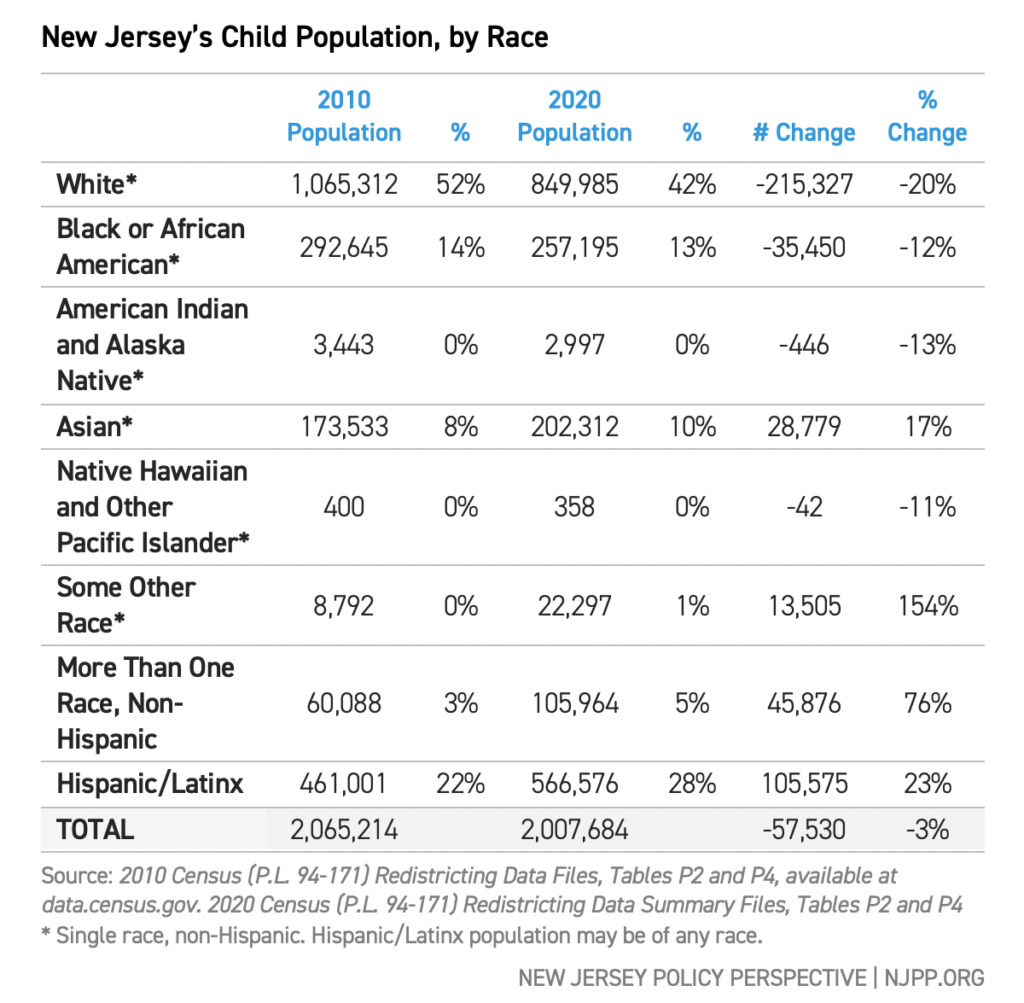
Many of the trends of increased racial and ethnic diversity seen in the total population are amplified in the child population. The racial and ethnic breakdown of the state’s child population is of critical importance for lawmakers when considering the education, health care, and language access needs of New Jersey’s children.
The child population has higher percentages of Hispanic/Latinx (28 percent), Black/African American (13 percent), and multiracial (5 percent) populations than New Jersey’s total population. These figures mirror trends in annual surveys like the American Community Survey.
However, the child population declined by about 57,000 children between 2010 and 2020, falling roughly 3 percent. It’s unclear from the data what could be causing this decline.
County-Level Changes
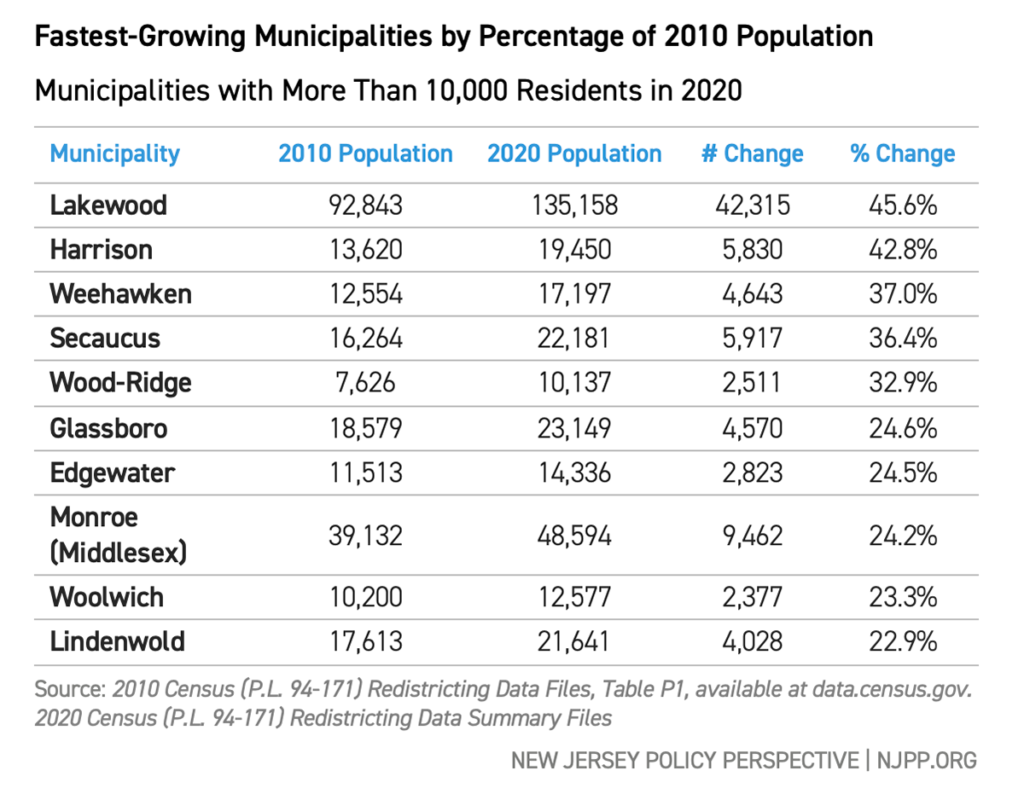
New Jersey’s population trends by county showed the shifts in growth statewide. While some counties grew by more than 10 percent (Hudson, Ocean, and Essex), others like Sussex, Cape May, Salem, Cumberland, and Atlantic Counties lost population. Most of New Jersey’s population gain over the last decade was concentrated in counties closest to New York City, as well as in Lakewood and surrounding areas in Ocean County.
Congressional and Legislative Districts
The constitutional purpose of the decennial Census is the redrawing of electoral district boundaries for Congress and state legislatures. As populations grow and change, district lines must also shift to reflect the principle of one-person-one-vote and allow for fair representation of all residents. This means each district must have roughly the same number of residents and, in the case of congressional redistricting, nearly identical resident counts. To do so, the redistricting commissions need to evaluate which districts have grown and shrunk in the last decade, and how to even out their populations. This redistricting process is already underway in New Jersey. For more information on New Jersey’s upcoming redistricting process, more resources are available at Fair Districts NJ.
New Jersey will retain its twelve congressional districts over the next decade, but their lines will likely change to properly balance population. In northeast New Jersey, Congressional Districts 8, 9, and 10 grew faster than the statewide rate, as did District 4 due to population growth in Ocean County, while others will have to add population to maintain equality across districts, notably District 2, which covers the southern end of the state.
Importantly, the following tables do not reflect New Jersey’s new law that requires the redistricting commission to draw state legislative district lines with incarcerated persons counted at their prior residence. Instead, these data follow the Census Bureau’s policy of counting all residents where they live as of April 1, 2020, meaning that incarcerated individuals are counted in the secured facility they live in, rather than the address they stayed at prior to incarceration.
The changing demographics also mean that redistricting will have to be careful not to “pack” or “crack” racial or ethnic groups to dilute their voting power. These two techniques form the basis of most gerrymandering by shifting boundary lines around particular populations.
- Packing occurs when one disfavored group is concentrated into a small number of districts, giving them overwhelming wins in just those districts while limiting their proportional impact in other districts.
- Cracking occurs when the disfavored group is divided and spread out among a large number of districts, so they consistently are unable to break 50 percent of the vote.
Often these tactics occur in tandem, packing most of a group into a few districts, then cracking the remainder among the remaining districts. For more information on this topic, the Princeton Gerrymandering Project has extensive resources on gerrymandering.
A parallel process is also underway to set legislative district lines. This process is made more challenging because municipalities must remain intact and cannot be split among different districts, with the exception of Jersey City and Newark, which can each be split into no more than two districts.
The five legislative districts that grew the fastest were District 30 (Lakewood), Districts 31 and 33 (Jersey City), and Districts 28 and 29 (Newark). These mirror the changes seen in municipality growth. To reflect the principle of “one-person, one-vote,” each district should have roughly equal population, with the new “ideal” district having 232,225 residents. Faster growing districts will have to be reduced in size to get closer to this district size, while districts that will have to gain in population to keep pace include District 24 (Sparta), District 1 (Vineland), and District 2 (Atlantic City).
Municipal Population Changes
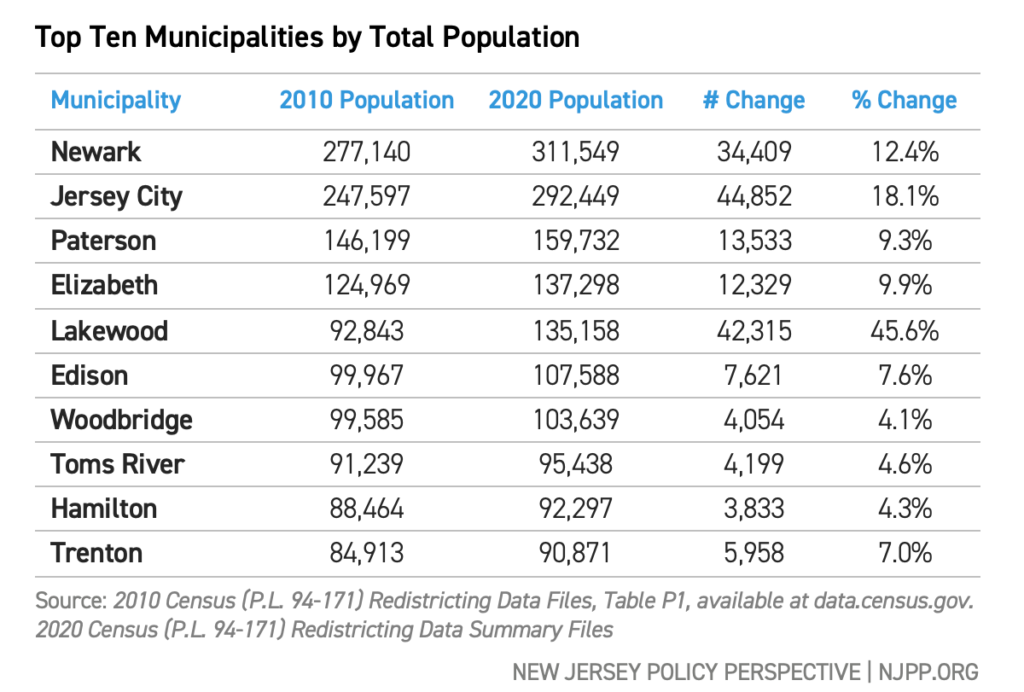
The growth statewide is reflected in the growth in New Jersey’s largest municipalities. Newark retained its crown as New Jersey’s largest city, fending off faster growth in Jersey City. Both cities had extensive Census campaigns to assist residents in completing the questionnaire and ensure an accurate 2020 Census count.
Elsewhere in the top ten, Lakewood leapfrogged Edison and Woodbridge to the Number 5 spot, while Trenton held its 10th place position over Clifton.
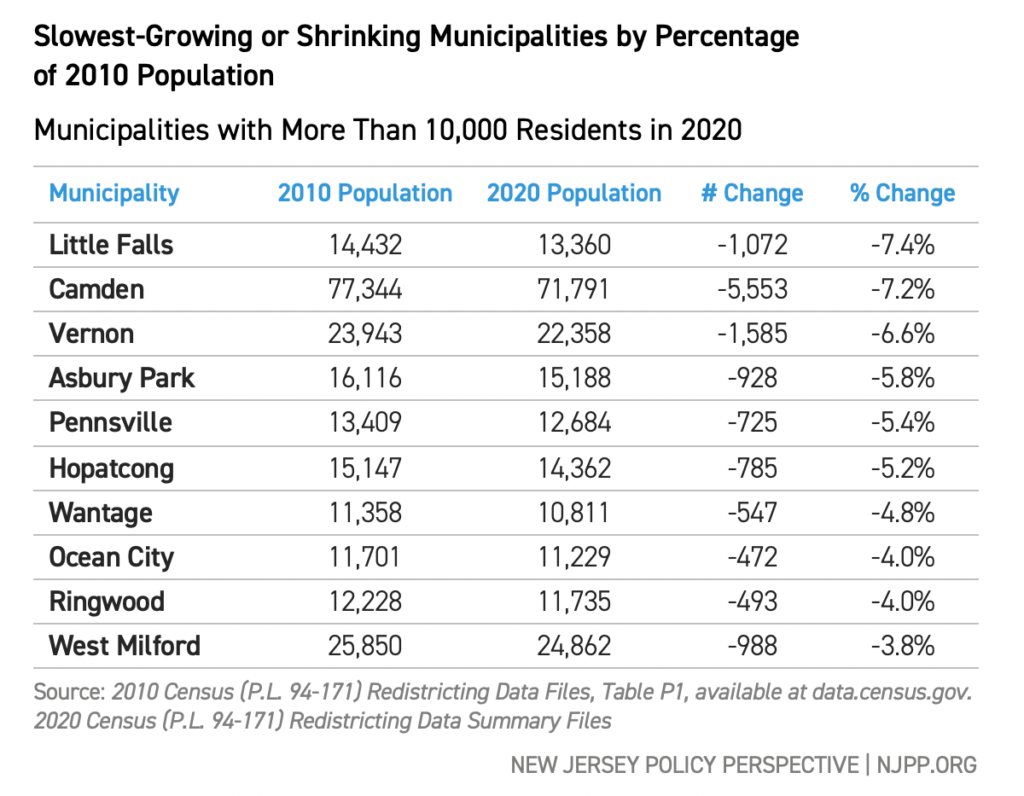
The municipalities (with more than 10,000 residents) with the highest population growth since 2010 are:
- Jersey City (+44,852),
- Lakewood (+42,315),
- Newark (+34,409),
- Paterson (+13,533), and
- Elizabeth (+12,329).
As New Jersey develops municipal and statewide policy, they must accurately reflect the reality of where people live, especially as municipal growth drives New Jersey’s statewide growth more broadly. New Jersey’s ten largest cities grew at a rate of 12.7 percent, more than double the statewide rate of 5.7 percent.
Conclusion
The redistricting data release is just the first step in the redistricting process, as more fine-grained Census data has yet to be released — including more data on racial, ethnic, and national origin identification, as well as detailed age and sex data. Even at this level of general data, however, it is clear that New Jersey continues to grow larger and more diverse. Its institutions and political boundaries should reflect this new reality.

